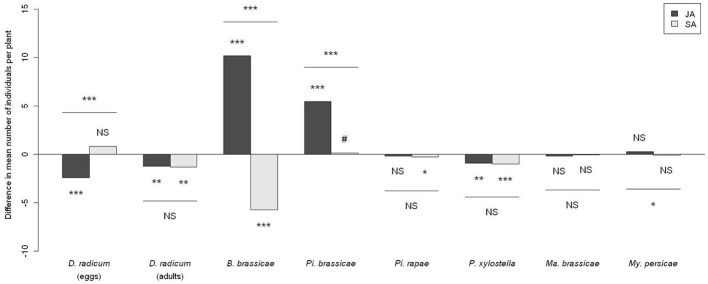
Figure 1.

Difference in herbivore abundance between phytohormone-treated plants and control plants. Significancy of differences computed by an analysis of contrasts following a Wald test on a GLMM. JA, plants treated with jasmonic acid; SA, plants treated with salicylic acid. NS P > 0.10, # P < 0.10, *P < 0.05, **P < 0.01, ***P < 0.001.
