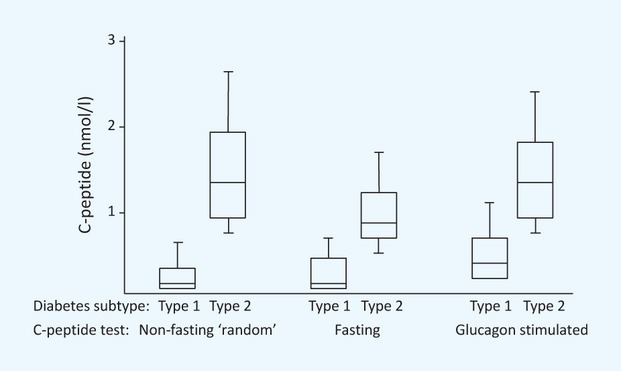
FIGURE 1.

Boxplot of random non-fasting (with glucose > 8 mmol/l), fasting and glucagon-stimulated C-peptide in well-defined (on clinical features) Type 1 (n = 371) and Type 2 (n = 732) diabetes. Redrawn with permission from Berger et al. ([39]). Horizontal line represents median, box interquartile range, ‘whiskers’ represent 10–90% of values.
