
Figure 3. SFB-containing flora sustains chronic proliferation of self-reactive CD4+ T cells.
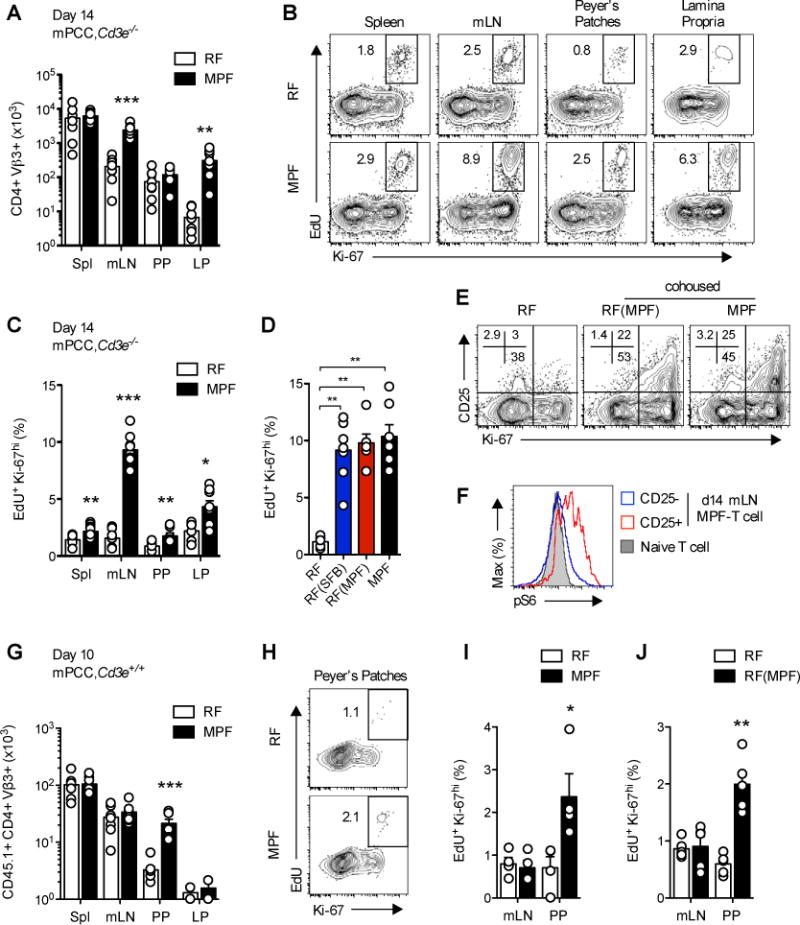
(A–D) 14 days post naïve 5C.C7 T cell transfer, mPCC, Cd3e−/− hosts were injected with EdU and sacrificed 1hr. later. (A) Absolute number of CD4+Vβ3+ T cells in spleen, mLN, Peyer’s patches (PP) and lamina propria (LP) of the small intestine. (B) Representative EdU and Ki-67 expression profiles and (C–D) Frequency of EdU+Ki-67hi cells in live, CD4+Vβ3+ T cells isolated from indicated organs of RF- or MPF-housed hosts (B–C) or mLN of indicated hosts (D). Data (mean±SEM) pooled from 3 independent experiments each ((A–C) n=8 and (D) n=6–7 mice per group).
(E) Representative CD25 and Ki-67 expression profiles, gated on CD4+Vβ3+ T cells and (F) representative phosphorylated S6 ribosomal protein (pS6) expression profile in CD25− (open, blue line) and CD25+ (open, red line) CD4+Vβ3+ T cells isolated from mLN of indicated hosts at day 14 and compared to naive 5C.C7 T cells (closed, grey). (G–I) 10 days post transfer of naïve CD45.1+ 5C.C7 T cells into 4–5 wk. old mPCC, Cd3e+/+ hosts, the recipient mice were injected with EdU and sacrificed 1 hr. later. (G) Absolute number of CD45.1+CD4+Vβ3+ T cells recovered at day 10 from indicated organs. (H) Representative EdU and Ki-67 expression profiles and (I) frequency of EdU+Ki-67hi cells in live, CD45.1+CD4+Vβ3+ T cells isolated from mLN and PP. Data (mean±SEM) pooled from 6 (G) and 4 (H–I) independent experiments. (n=6 pools of 1 to 3 mice per group and 4 pools of 3 mice per group respectively). (J) Same as (I) in 8–12 wk. old RF-housed mPCC, Cd3e+/+ mice cohoused for 2 weeks with MPF-housed mPCC, Cd3e−/− mice prior to T cell transfer. Data (mean±SEM) pooled from 5 independent experiments, each representing one pool of 6 RF-housed or 2 cohoused-RF(MPF) mice. (G–J) All EdU and Ki-67 stainings were performed on purified CD4+ T cells. See also Figure S3.