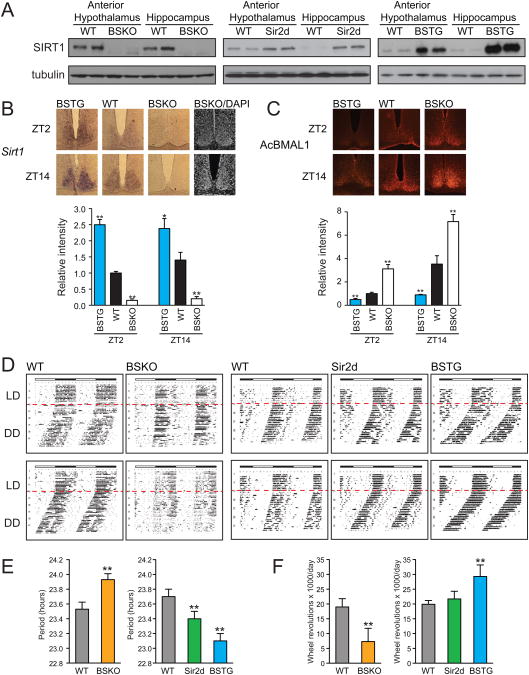
Figure 1. Circadian phenotypes of brain specificSirt1KO and transgenic mice.
(A) Immunoblot of SIRT1 in the anterior hypothalamus and hippocampus from the brain specific Sirt1 KO (BSKO), Sirt1 whole body transgenic (Sir2d) and brain specific Sirt1 transgenic (BSTG) mice. Tubulin was probed as a loading control. (B) Typical in situ hybridization images and relative signal intensities for Sirt1 mRNA in the SCN. Sections were prepared from 3 month-old mice that were sacrificed at ZT2 and ZT14 (n≥3 mice/genotype). Signal intensities were quantitated and are shown relative to wild type (≥6 sections). DAPI stained images were shown to indicate SCN in the BSKO sections. (C) Typical immunohistochemical staining results and relative signal intensities for acetylated BMAL1-K537 in the SCN. Sections were prepared from 3 month-old mice that were sacrificed at ZT2 and ZT14 (n=3 mice/genotype). Signal intensities of protein levels were quantitated and are shown relative to wild type (6 sections). Values represent the mean ± standard deviation. *P<0.05; **P<0.01; t test. (D) Actograms showing wheel-running activity in constant darkness after two weeks of light/dark entrainment. Representative results of 6 month-old male BSKO (n=10) and the littermate wild-type control mice (n=10) are shown on the left panel. Sir2d (n=6) and BSTG (n=7) compared to wild-type control mice (n=7) are shown on the right. Red lines indicate the starting day for constant darkness. (E) Bar graphs of innate periods of animals during the initial three weeks in constant darkness. (F) Total wheel revolutions performed per day in animals. Values in (E) and (F) represent the mean ± standard deviation. **P<0.01; t test.

