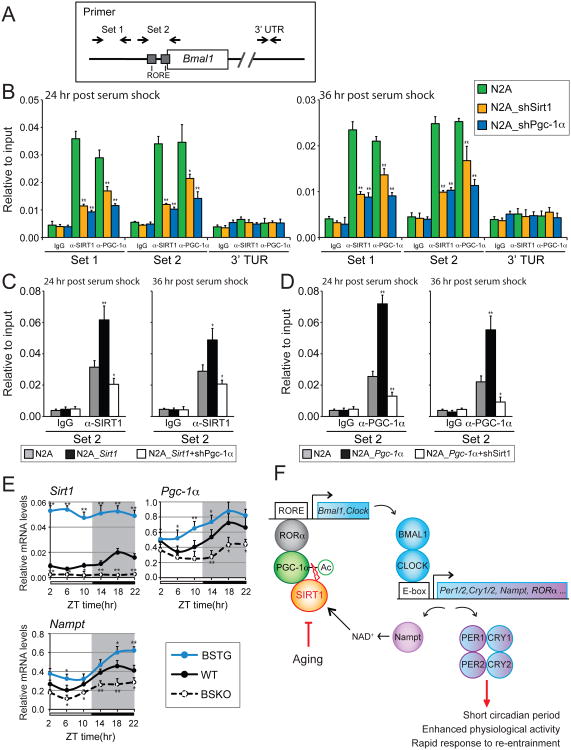
Figure 7. Cooperative binding of SIRT1 and PGC-1α at theBmal1promoter.
(A) Schematic view of primer locations. Primers that flank two RORE sequences (Set 2) and another upstream region (Set 1) at the Bmal1 promoter are showed. Control primers were designed at the 3′UTR of Bmal1 gene (See Table S1). (B) Chromatin-immunoprecipitation (ChIP) assays in N2a cells. Cells were transfected with a vector control or shRNA knock down constructs for SIRT1 or PGC-1α (B). Overexpression of SIRT1 (C) and PGC-1α (D) were ChIP assayed as in (B) with indicated knock down of PGC-1α or SIRT1, respectively. Rabbit IgG was used as an immunoprecipitation control. Assays were performed 24 hr or 36 hr after synchronization with 50% horse serum. ChIP results were analyzed by qPCR. (E) Oscillation of Sirt1, Pgc-1α and Nampt in the SCN. SCN enriched samples were isolated from 6 month-old male mice at 4 hr intervals across the 12:12 light/dark cycle (n=3-4 mice/genotype/time point). Target gene expression levels are shown relative to a ribosomal reference gene, rpl19. Values represent the mean ± standard deviation. *P<0.05; **P<0.01; t test. (F) Schematic model of SIRT1 mediated circadian gene activation in the SCN. The model depicts an oscillating loop that amplifies expression of BMAL1, CLOCK, and their targets. Age-associated decline of SIRT1 results in circadian phenotypes such as prolonged period and a defect in re-entrainment. See also Figure S5.

