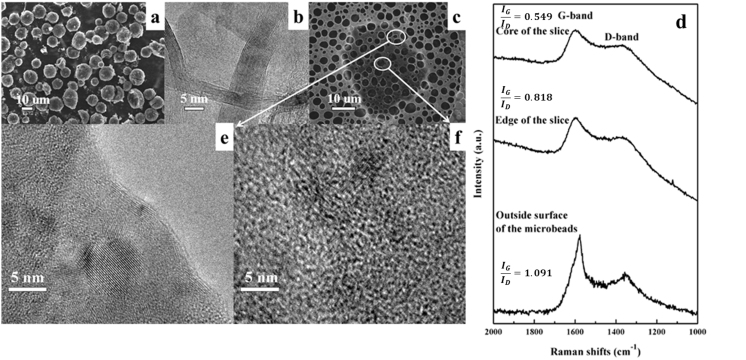
Figure 2. Morphological and structural analysis of PGC.
(a) SEM image of MCMB-based PGC; (b) HRTEM image of PGC powders; (c) SEM image of the PGC slice on a Cu TEM mesh; (d) HRTEM image of the edge of the slice shown in Fig. 2(c); (e) HRTEM image of the core of the slice shown in Fig. 2(c); (f) Raman spectra of the outside surface of PGC particles and the core or edge of the slice.

