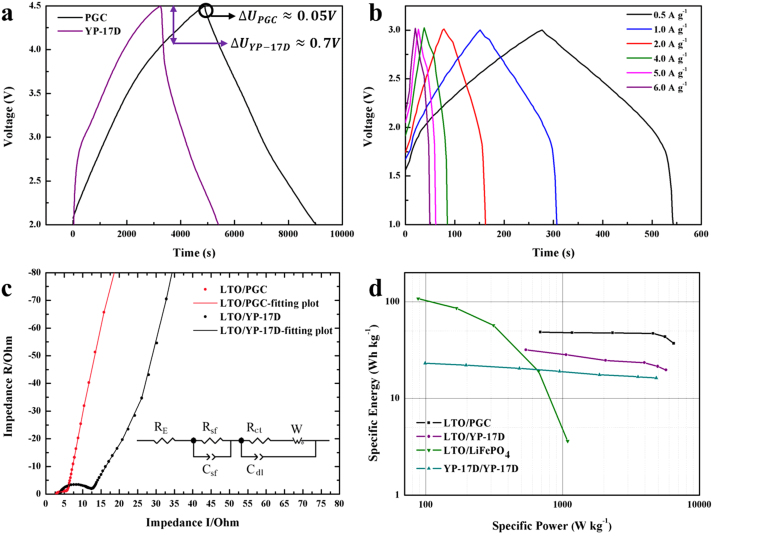
Figure 3.
(a) the charge-discharge curves of half cells: the PGC and YP-17D electrodes. (b) Charge/discharge curves for LTO/PGC hybrid supercapacitor. (c) AC impedance plots of LTO/PGC and LTO/YP-17D hybrid supercapacitors. The equivalent circuit is given in the inset. (d) Ragone plots of the LTO/PGC and LTO/YP-17D hybrid supercapacitors obtained from the discharge curves measured at different constant current densities.

