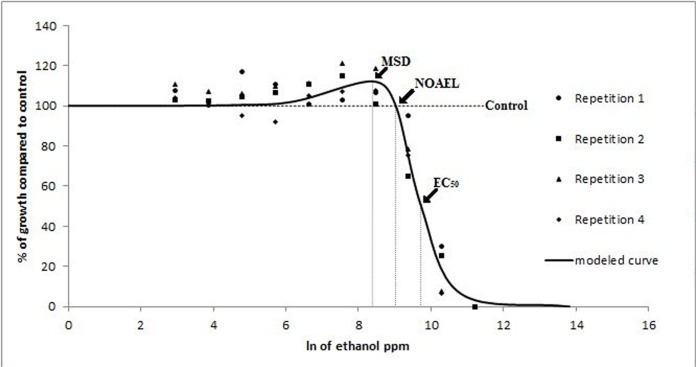
FIG. 4.
Modeled curve of the radial growth in vitro of R. zeae in response to subinhibitory doses of ethanol. Radial growth is expressed as percentages relative to a non-amended control, and concentrations as natural logarithm of ppm. Each data point in the figure represents the mean value of three replicates. The slope of the curve at the EC50 (β) was 2.83 and the rate of increase at low doses (γ) was 8.26. Low-dose stimulation was observed.

