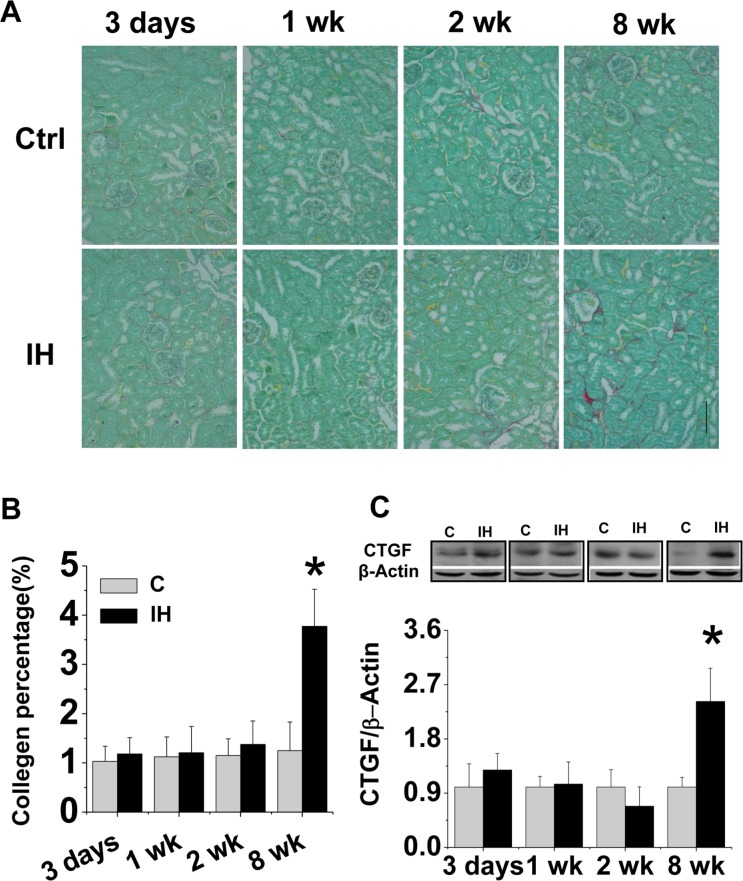
FIGURE 3.
Effects of IH on renal fibrosis. Kidney tissue was stained with Sirius-red for collagen (A). Original magnification x 200. Bars: 50 μm. Semi-quantitative analysis was done by computer imaging system (B). Renal expression of CTGF was examined by Western blotting assay(C). Data are presented as mean ± SD (n = 3 – 8). *, p < 0.05 vs corresponding controls.

