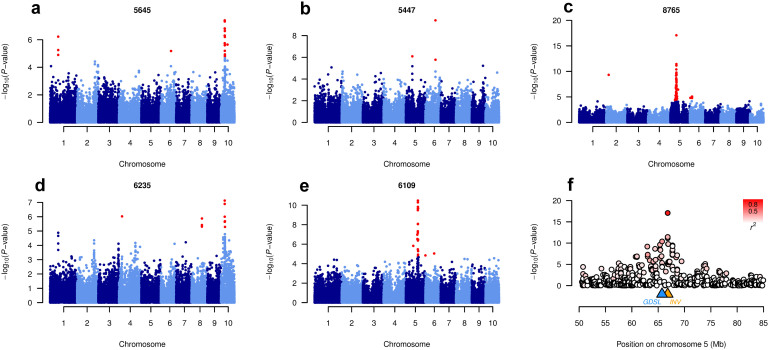
Figure 2. Five examples of GWA mapping results.
(a–e) Manhattan plots for lipids 5645, 5447, 8765, 6235, and 6109. P-values obtained from a Q10 + K mixed model analysis are shown on a –log10-scale and colored in red if significant with FDR ≤ 0.025. (f) Regional association plot for lipid 8765. The positions of the candiate genes GDSL esterlase/lipase and invertase (INV) are shown as triangles. Level of linkage disequilibrium (r2) with the top hit SNP is shown in red color.

