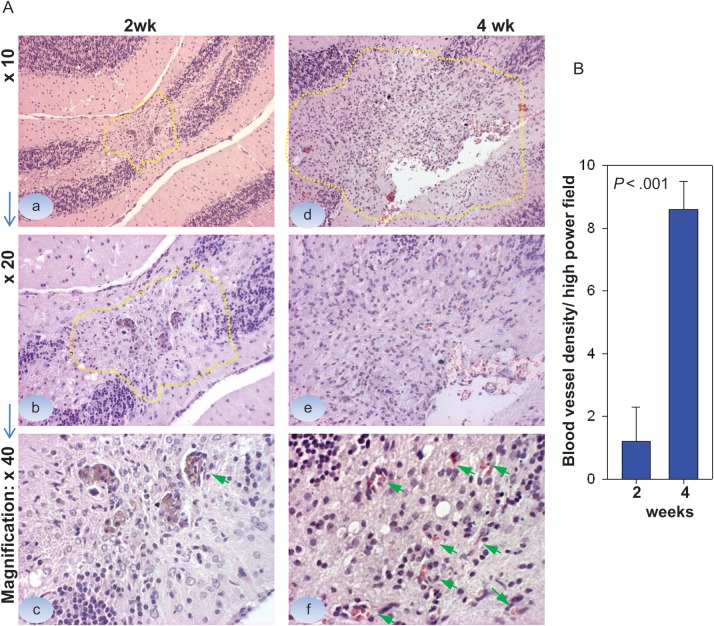
Fig. 5.
Comparison of microvessel density between the small and the medium-sized xenograft tumors in IC-1227AA. (A) Representative images showing the overall sizes of xenograft tumors 2 wk (a, b) and 4 wk (d, e) post tumor cell injection. Microvessel density was estimated by counting the intratumoral blood vessels containing <8 red blood cells under high power (×40) magnifications (c, d, arrows). (B) Graph showing the significantly lower density of blood vessels in the 2-wk tumors compared with the 4-wk tumors (P < .001).

