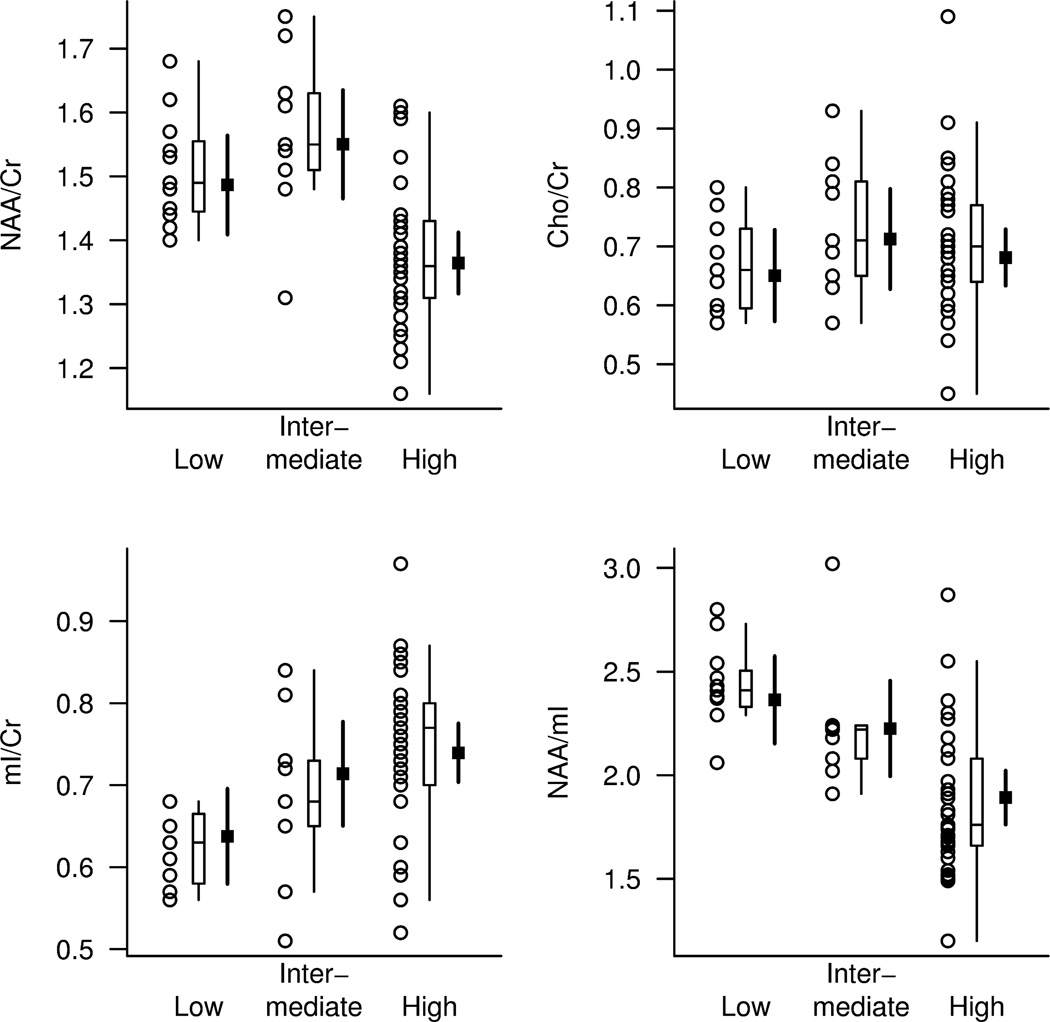
Figure 2. Posterior cingulate gyrus voxel 1H MRS findings by pathological diagnosis of AD.
The pathological diagnosis of AD is classified as low, intermediate and high likelihood of AD. For each pathological diagnosis, the plot shows individual values, a box plot of the distribution, and the estimated mean and 95% CI for the mean. The strongest association was observed with the NAA/mI ratio (RN 2=0.40) 46. Cho = choline; Cr = creatine NAA = N-acetylaspartate, Ml=
With permission from Radiology.

