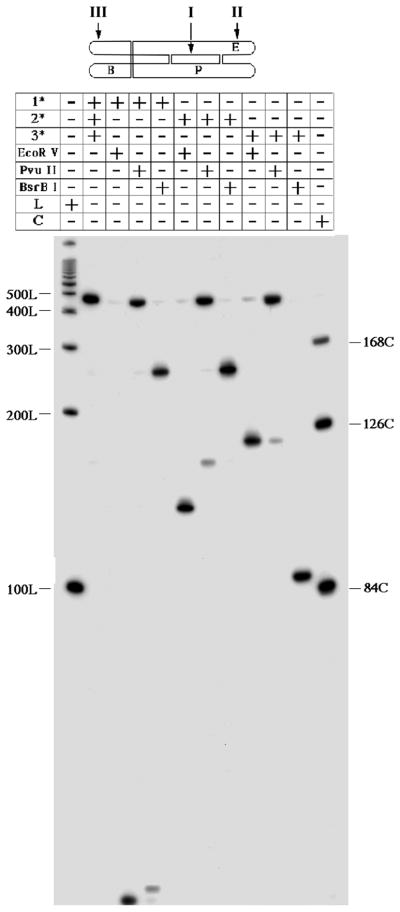
Figure 3. Characterization of the Experimental Molecule.

An autoradiogram of a 5% denaturing gel. The molecule is shown at the top, with the strand numbers and first letters of the relevant restriction sites indicated. The chart at the top describes the contents of each lane. The notations 1*, 2* and 3* indicate the labeled strand for a particular experiment. Digestion by a particular restriction enzyme is noted. ‘L’ and ‘C’ indicate the presence in the lane of linear and circular markers, respectively.
