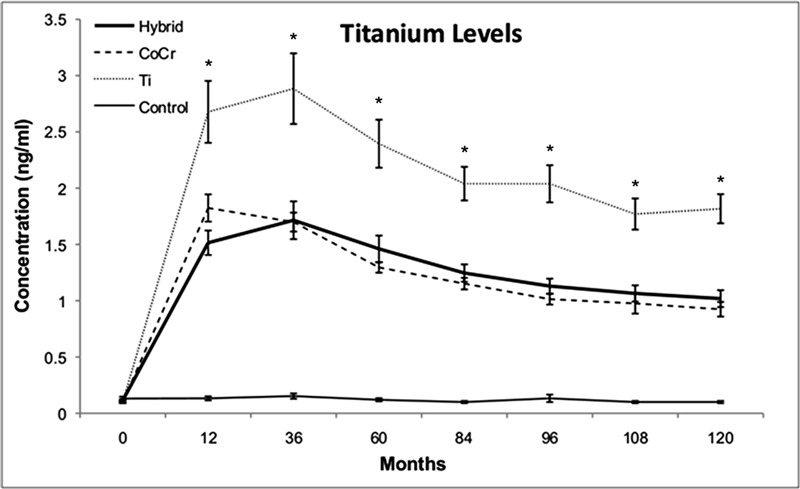
Fig. 3.

Serum titanium concentrations. Line graph showing the concentrations of titanium in the serum, in nanograms per milliliter (ng/mL, parts per billion), as a function of time in the four groups investigated. The titanium levels at 120 months were 8.9 times higher than they were at baseline in the hybrid group and 9.2 times higher than at baseline in the CoCr group. Serum titanium levels in the titanium (Ti) group were higher than those in all other groups at all follow-up intervals, and they were eighteen times higher than baseline levels at 120 months (p < 0.01). *Titanium levels in the titanium group were significantly different than those in the hybrid and CoCr groups (p < 0.01).
