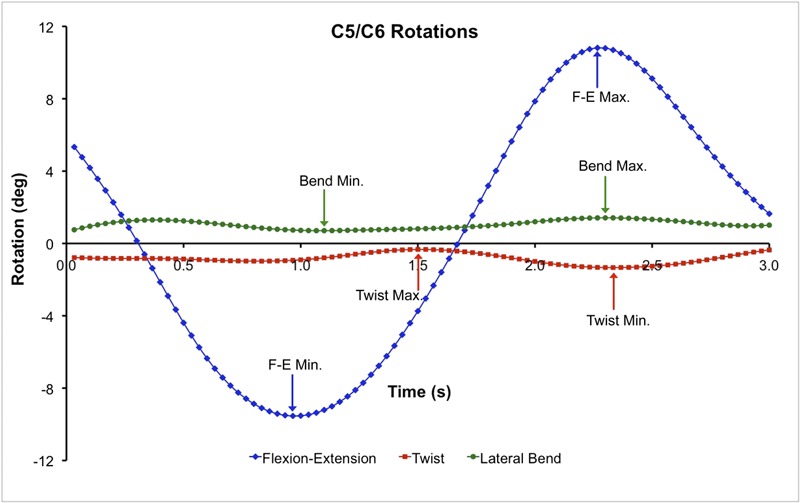
Fig. 3.

Flexion-extension (F-E), twist, and lateral bend angles between C4 and C5 for a representative subject. The arrows indicate maximum and minimum values for each curve over the entire flexion-extension trial. Maximum and minimum values for each rotation curve were determined for each cervical motion segment for each trial. The process was identical for determining translation range of motion. The symbols along the curves indicate instants when each of the ninety frames of biplane x-ray data were collected and analyzed.
