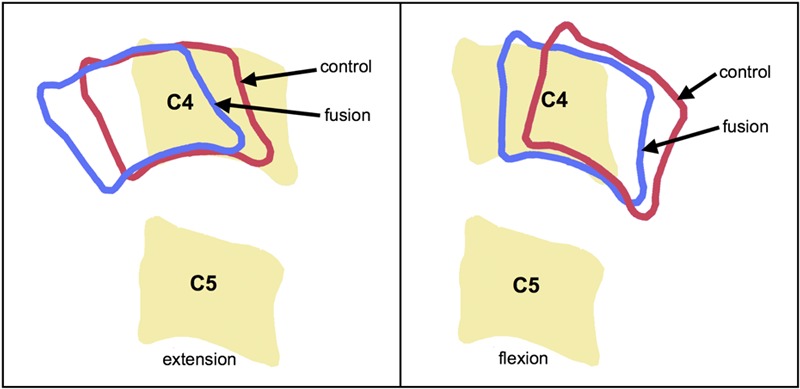
Fig. 4.

Representation of flexion-extension range of motion in the C5/C6 arthrodesis (fusion) and control groups. The neutral position of C4 and C5 are shown as solid bones, with the movement in control subjects (red) and subjects treated with arthrodesis (blue) represented by bone outlines in full extension (left) and flexion (right). The total range of motion adjacent to the arthrodesis did not differ between groups; however, the subjects treated with arthrodesis had greater extension and posterior translation range of motion at full extension and less flexion and anterior translation at full flexion.
