
Fig. 3.
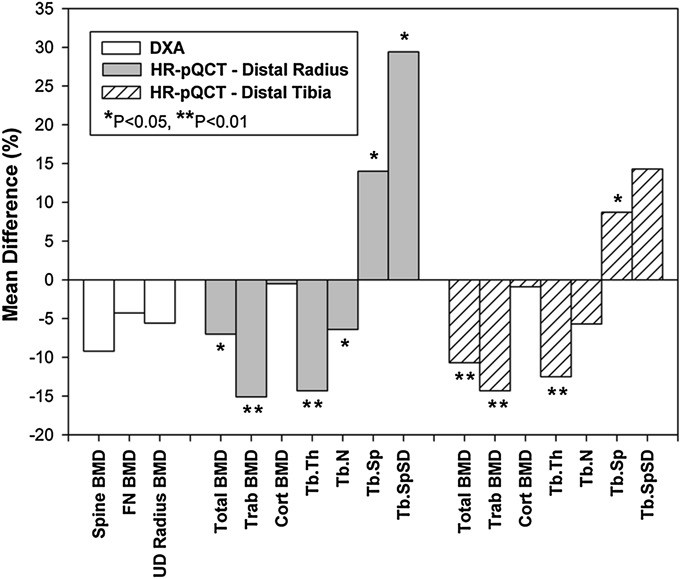
The mean differences in bone mineral density (BMD) and bone microarchitecture between the fracture and control groups. FN = femoral neck, UD = ultradistal, Trab = trabecular, cort = cortical, Tb.Th = trabecular thickness, Tb.N = trabecular number, Tb.Sp = trabecular separation, Tb.SpSD = standard deviation of trabecular separation, HR-pQCT = high-resolution peripheral quantitative computed tomography, and DXA = dual x-ray absorptiometry.