
Fig. 1.
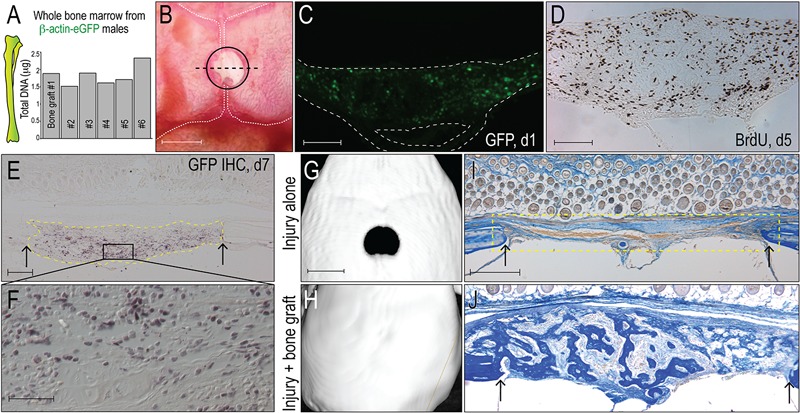
Bone grafts have osteogenic potential. Fig. 1-A Quantification of total DNA in representative aliquots of whole bone marrow harvested from transgenic beta-actin-enhanced green fluorescent protein (β-actin-eGFP) male mice; each aliquot constitutes a bone graft. Fig. 1-B Bone grafts are transplanted into 2-mm-diameter critical-size calvarial defects (demarcated with a circle), which are created in the sagittal suture that separates the parietal bones (outlined with vertical white dashed lines). The dashed black line indicates the plane of tissue section. Fig. 1-C Representative tissue section from the injury site on post-transplant day 1; GFP immunostaining identifies grafted cells from the eGFP donor (n = 5); the inferior space represents the sagittal sinus. Fig. 1-D Representative tissue section on post-transplant day 5; immunostaining for bromodeoxyuridine (BrdU) identifies cells in S phase. Fig. 1-E On post-transplant day 7, GFP immunostaining identifies the bone graft (dotted yellow line); a higher magnification image of the boxed area in Fig. 1-E (Fig. 1-F) illustrates that the majority of the cells in the injury site are derived from GFP-positive graft. Fig. 1-G On post-transplant day 14, micro-CT reconstruction confirms that a 2-mm calvarial injury constitutes a critical-size nonhealing defect (n = 6)40. Fig. 1-H The same size calvarial injury, treated with a bone graft, heals (n = 6). Figs. 1-I and 1-J On post-transplant day 7, aniline blue staining was used to identify new osteoid matrix; no osteoid matrix formed in the untreated injury site (yellow dotted line). Fig. 1-J shows visible osteoid matrix on post-transplant day 7 in a representative sample that had been treated with a bone graft. Abbreviations: IHC = immunohistochemistry. Arrows mark the edges of intact bone. Scale bars: 2 mm (Fig. 1-B); 200 μm (Figs. 1-C and 1-D); 100 μm (Fig. 1-E); 40 μm (Fig. 1-F); 2 mm (Fig. 1-G); and 200 μm (Fig. 1-I).