
Figure 3. Volcano plots of significantly differentiating proteins.
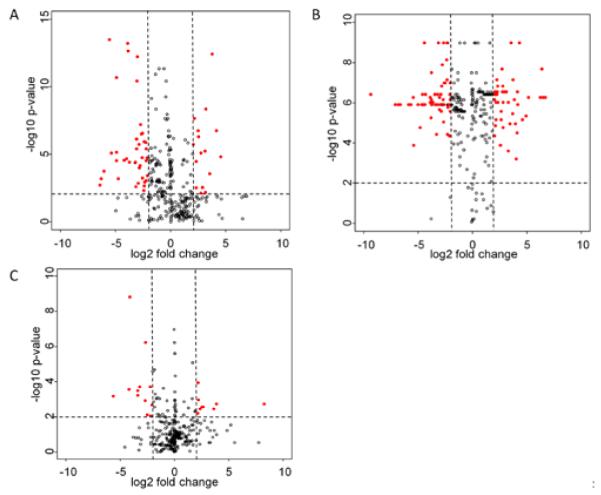
The negative log (base 10) of the Mann Whitney U p-values are plotted on the y-axis and the log (base 2) of the fold change are plotted on the x-axis. A) Metastatic melanoma versus benign. B) Primary melanoma versus benign. C) Metastatic melanoma versus primary melanoma. The red data points indicate proteins with a p-value < 0.01 and a fold change > 2.