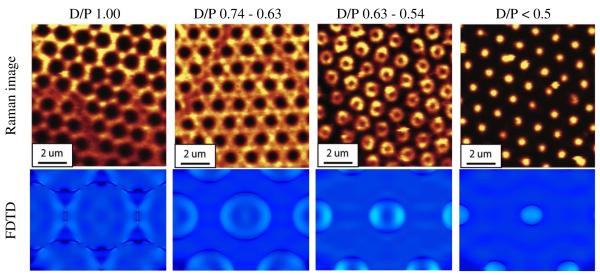
Figure 4.
(Top row) False color Raman microscopy images of a 10 × 10m region for nanohole arrays of decreasing D/P ratios from left to right respectively. (Bottom row) FDTD images of a 3 × 3m region for nanohole arrays corresponding to the same D/P regions as for the Raman images. For the Raman images and the FDTD simulations, the periodicity of the nanohole arrays is 1500 nm, illuminated with a 532 nm laser.

