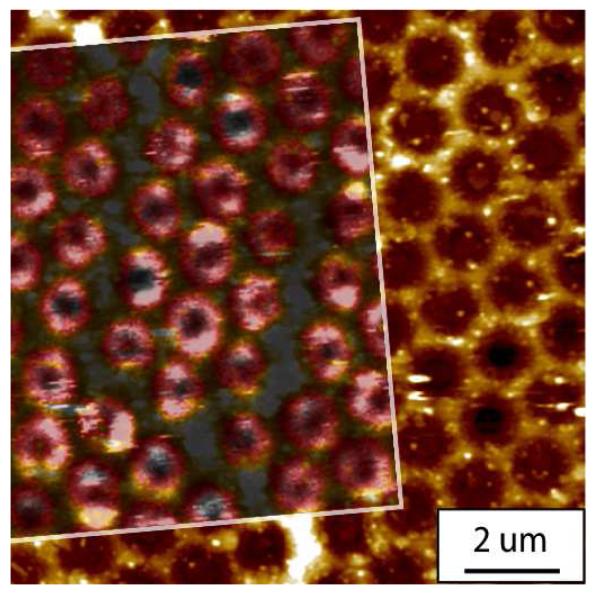
Figure 5.

Correlated AFM and SERS images of a nanohole array with a D/P ratio of 0.64. The false color Raman image (pink) was acquired at 633 nm, which is delimited by the white boundaries. The ring attributed to the high Raman intensity is co-localized with the rim of the nanohole, which is in agreement with the FDTD calculations.
