Figure 1.
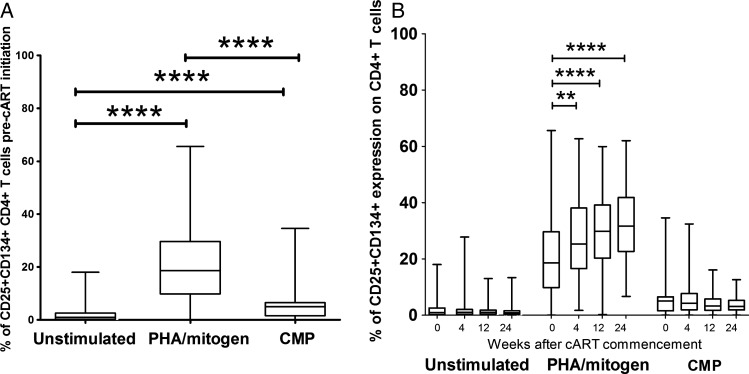
Percentage of CD4+ T cells that express CD25+ and CD134+ in unstimulated cultures or following stimulation with phytohemagglutinin/mitogen or cryptococcal mannoprotein in whole blood collected from patients pre-combination antiretroviral therapy (cART) (A) and over 24 weeks of cART (B). Data are shown as a box-and-whisker plot with the median and 25th and 75th percentiles shown as the middle, lower, and upper lines of the box, respectively. P values are indicated as *P < .0500, **P < .0100, ***P < .0010, and ****P < .0001.

