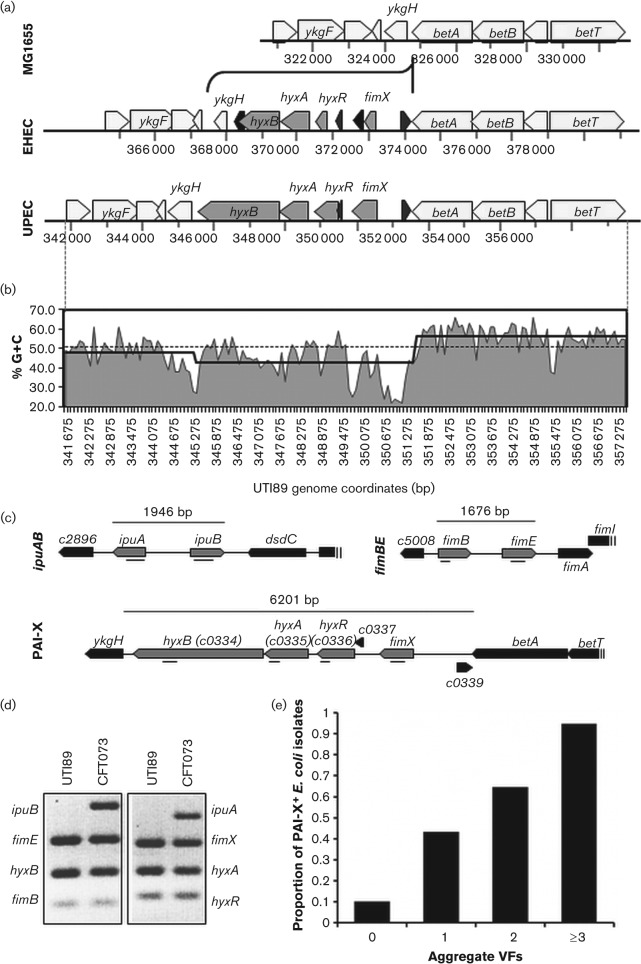
Fig. 1.
Overview of the genomic location, features, and organization of PAI-X among sequenced E. coli isolates. (a) Genomic organization and conservation of PAI-X among sequenced isolates from EHEC (EDL933) and UPEC (UTI89) pathotypes. MG1655 is used as a K-12, commensal reference. (b) Percentage G+C trace of PAI-XUTI89 and surrounding flanking regions. Percentage G+C is plotted as area under the curve for the entire region (betT through ykgE) using a 100 bp window. The average G+C across the entire UTI89 genome is plotted as a grey dotted line. The average % G+C content across PAI-X and flanking sequences is plotted as a black stepped line. (c) Grey arrows represent ORFs detected by multiplex PCR. Directionality of the ORFs, representing forward or reverse strand orientation, is shown. Amplicons are indicated as a black line (_). The genomic sequence for ipuA and ipuB is shown for CFT073 while fimB, fimE and PAI-X sequences are shown for the prototypic cystitis isolate UTI89. (d) Representative results of the multiplex PCR for the Fim-like recombinases and associated genomic islands using multiplex PCR. UTI89 and CFT073 are shown as prototypic UPEC strains to show visualization of all bands. (e) All E. coli isolates (n = 259), regardless of clinical syndrome, were scored based on the number of selective VFs present by PCR analysis and evaluated for the correlation between E. coli total VFs and the presence of PAI-X. Aggregate VFs refers to the number of total VFs present (out of the five assayed). Sample sizes varied between groups: 0 VFs (n = 30), 1 VF (n = 44), 2 VFs (n = 68), ≥3 VFs (n = 117).

