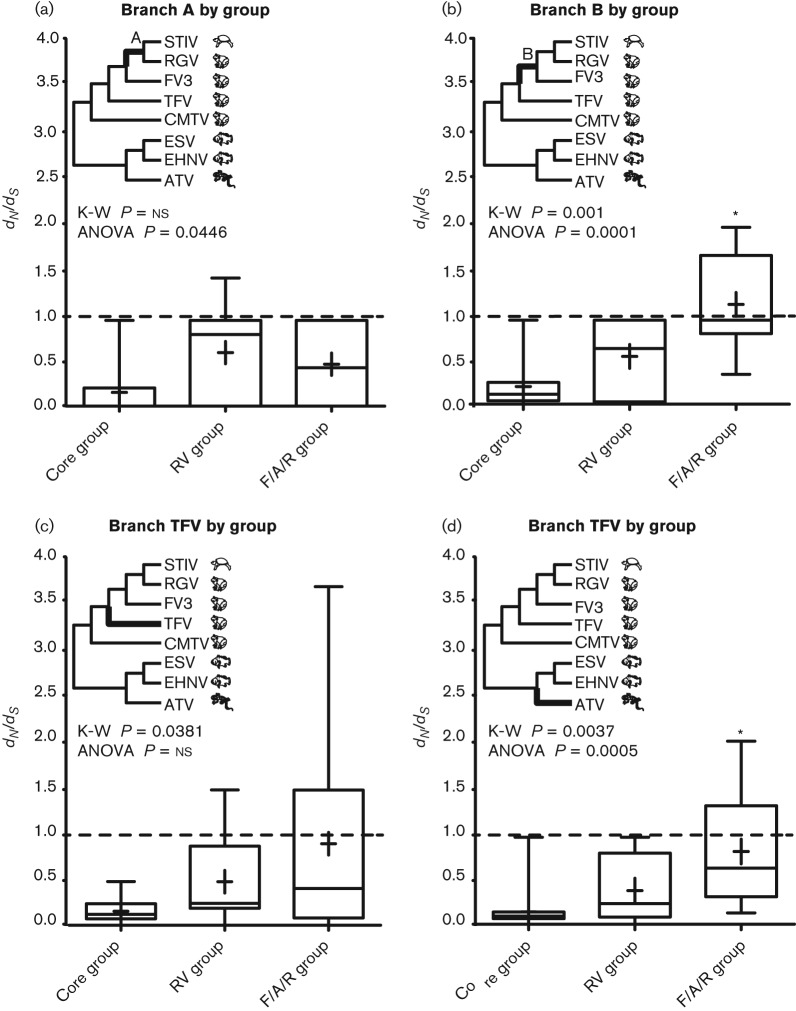
Fig. 5.
Significant differences in median and mean dN/dS values of the core, RV and F/A/R gene groups detected using branch-based tests. The inset phylogenies show the significant branches in bold. Boxplots for statistically significant branches are shown (branches without significant support are not shown). K-W tests (medians) were performed on the transformed dataset (square root of dN/dS, raw data shown). One-way ANOVA tests (means) were performed on the transformed dataset (square root of dN/dS, raw data shown). An asterisk indicates that the mean of the F/A/R gene group was statistically different from the core gene group based on Bonferroni post-tests.

