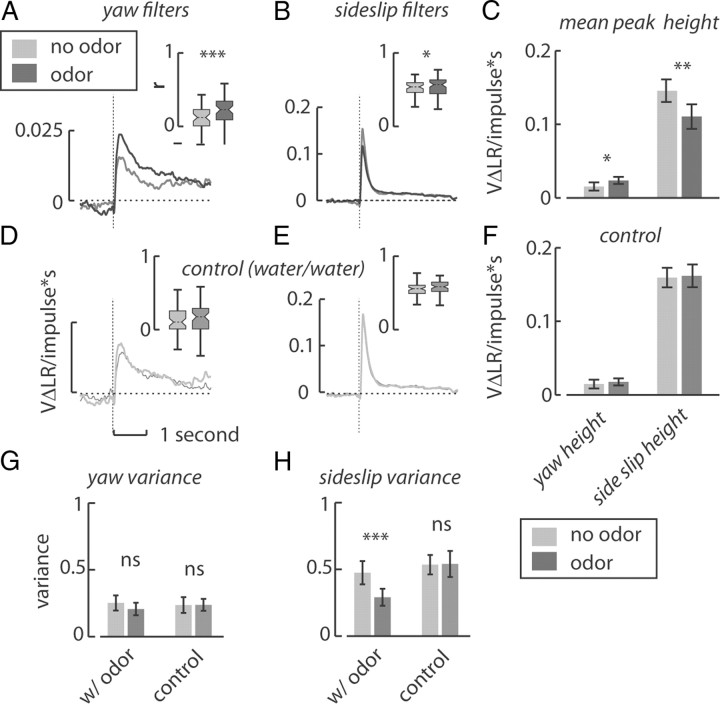
Figure 2.
Olfactory cues modify the gain and reliability of the optomotor response. A, B, The yaw optomotor filter increases in magnitude (no odor N = 51, odor N = 58) and in the prediction–response correlation (inset) due to the influence of odor (no odor gray, odor black) (A), whereas the sideslip filter decreases in height but does not change in predictive power (no odor N = 66, odor N = 71) (B). These changes in magnitude reflect changes in the gain of the filters in linear systems theory. C, The measured changes in height at the peak of each filter (∼236 ms for yaw and 109 ms for sideslip) differed significantly due to the influence of odor (paired t test). D–F, In contrast, replacing the odor port with a second water vapor tube did not result in any qualitative changes in either the yaw (no odor N1 = 57, no odor N2 = 62) (D) or sideslip (no odor N1 = 75, no odor N2 = 72) (E) filters or statistical differences in their peak heights (F). G, H, Olfactory cues did not significantly increase the variance of the yaw steering response (G) but did significantly decrease the variance of the sideslip steering response (H). These changes in variance imply that the observed increase in filter gain due to odor is due to an increased steering effort correlated to the white noise stimulus (*p < 0.05, **p < 0.01, ***p < 0.001).

