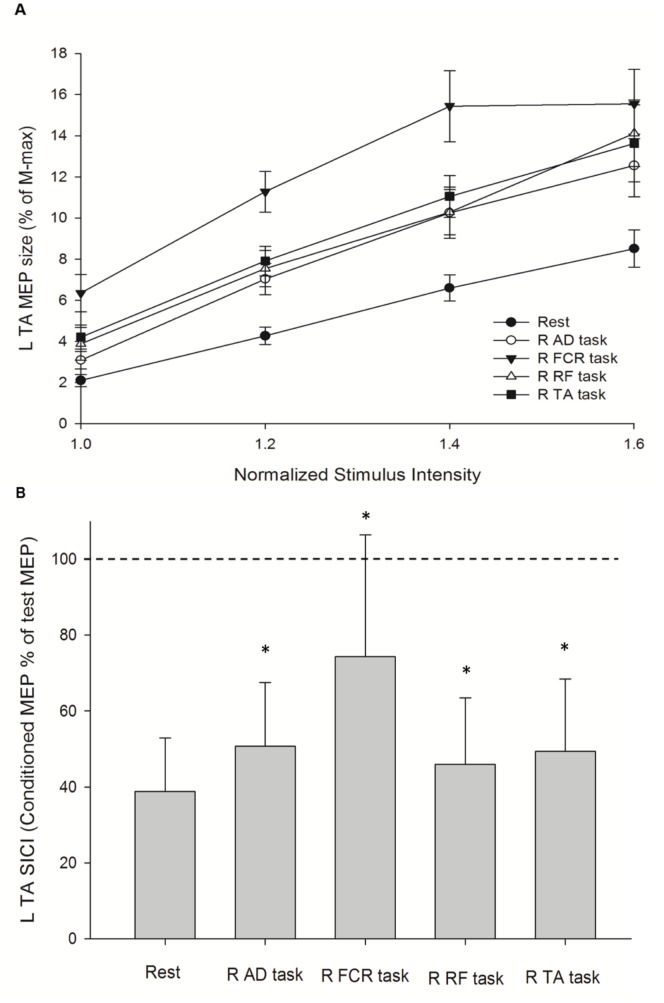
Figure 3. Increased corticospinal output and decreased intracortical inhibition of the left tibialis anterior (L TA) muscle during unilateral motor task.
(A) Recruitment curves of motor evoked potential (MEP) at rest and during the three active conditions that were performed by muscles on the right side. The abscissa shows intensity of transcranial magnetic stimulus expressed relative to the resting motor threshold in each subject. The ordinate shows MEP amplitudes as a percentage of the L TA M-max. Data are presented as the mean ± standard error from all 15 subjects. (B) Ratio of short-interval intracortical inhibition (SICI) at rest and during the four active conditions. The size of the conditioned MEP is expressed as a percentage of the amplitude of the test MEP (horizontal dotted line). Data are presented as the mean ± standard deviation from all 15 subjects. Asterisks indicate statistically significant differences from the rest condition (*p<0.05) by repeated-measures ANOVA following a post hoc contrast test. R: right; AD: anterior deltoid; FCR: flexor carpi radialis; RF: rectus femoris; TA: tibialis anterior.

