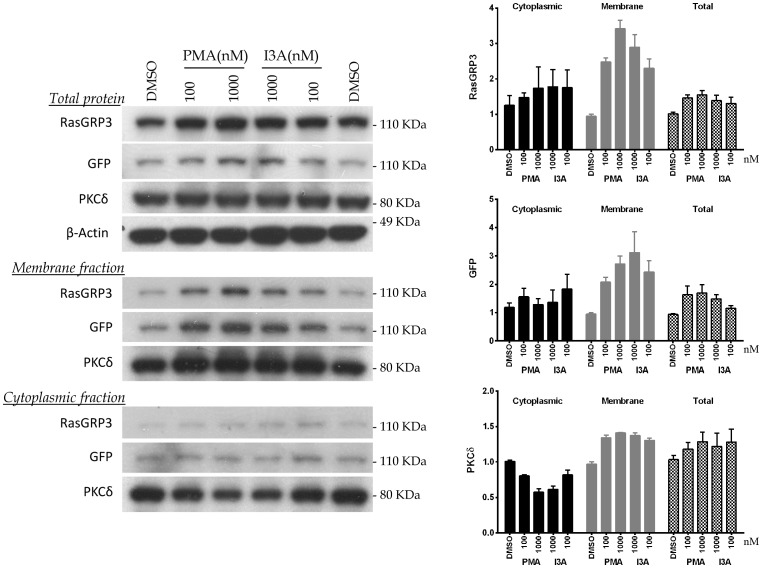
Figure 5. Changes in subcellular distribution of RasGRP3 and PKCδ in response to treatment with PMA or I3A.
HEK-293 cells expressing GFP-RasGRP3 were treated for 30 minutes with PMA or I3A at the indicated concentrations. Cell sonicates were subjected to subcellular fractionation and the levels of PKCδ and RasGRP3 were analyzed by immunoblotting. For RasGRP3, expression was detected both with an anti-RasGRP3 antibody and with an antibody against the GFP tag. Bars indicate quantitation (mean ± SEM) of the results from three independent experiments. A representative immunoblot is illustrated.

