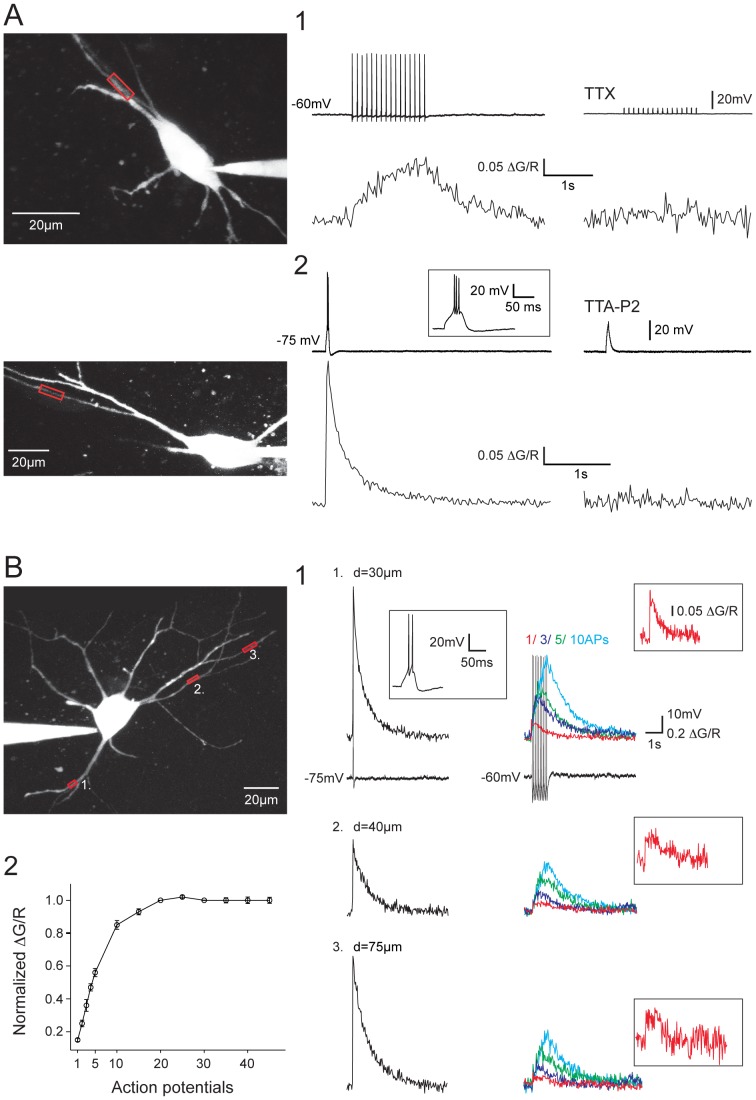
Figure 1. Dendritic Ca2+ responses evoked by tonic APs or LTS in NRT neurons.
A1. Dendritic ΔCa2+ triggered by somatically evoked train of 15 APs at 10 Hz (top record). Application of 0.5 µM TTX fully blocked the APs and the ΔCa2+ (bottom trace). A2. Dendritic ΔCa2+ triggered by a somatically evoked LTS. An enlarged record of the LTS is presented in inset. Application of 3 µM TTA-P2 fully blocked the LTS and the ΔCa2+. B. ΔCa2+ recorded in three different dendrites of the same neuron. B1. Dendritic ΔCa2+ evoked by LTS (left column) and 1, 3, 5 and 10 APs at 10 Hz (right column) in the different dendrites. Examples of the somatically recorded voltage responses are shown underneath the ΔCa2+ recorded in location 1 (an enlarged record of the LTS response is illustrated in inset). ΔCa2 recorded in response to a single back-propagating AP is presented at higher magnification in inset. B2. Plot of amplitude of ΔCa2+ evoked by back-propagating APs (n = 10 neurons). The amplitude was normalized to the ΔCa2+ evoked at the time of the 20th AP of the trains. Note the almost linear summation of the ΔCa2+ evoked by the first 5 back-propagating APs. In A and B the scanned dendritic regions are indicated by boxes on the maximal intensity Z projection of the neurons presented in the left panels.

