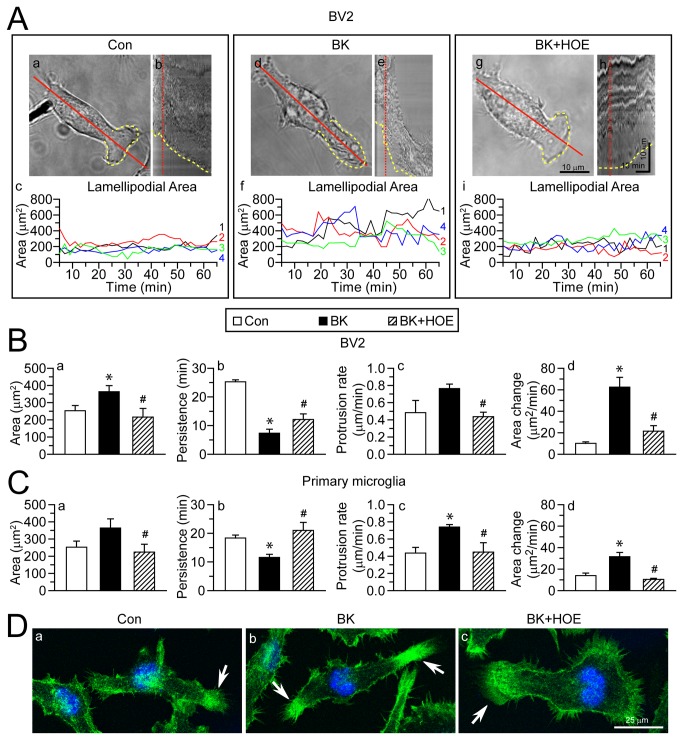
Figure 1. Inhibition of NHE-1 activity abolishes BK-induced lamellipodial dynamics in microglia.
A. Lamellipodia formation in BV2 microglia were shown in the presence of control serum-free medium (a), 300 nM BK (d), or 300 nM BK plus 1 µM HOE 642 (g). Yellow dashed line: leading edge lamellipodial area. Red solid line: axis through which kymographs were generated. Scale bar: 10 µm. b, e, h: Kymographs under three conditions showing the morphological changes of the leading edge integrated by the 60-min time. Red dotted line: time point in kymograph corresponding to accompanying still graphs. Horizontal scale bar: 15 min. Vertical Scale bar: 10 µm. c, f, i: fluctuations in lamellipodial area of four representative cells (#1-4, in four different colors). B–C. Lamellipodial area (a), persistence (b), protrusion rate (c) and area change (d) were calculated in BV2 (B) or in primary microglia (C). Data are mean ± SEM. n = 4. * p < 0.05 vs. Con. # p < 0.05 vs. BK. D. Phalloidin staining images of actin fibers in BV2 cells. Green: Alexa Fluor® 488 phalloidin. Blue: To-pro-3 nuclear staining. Arrow: actin fibers at lamellipodia. Scale bar: 25 µm.

