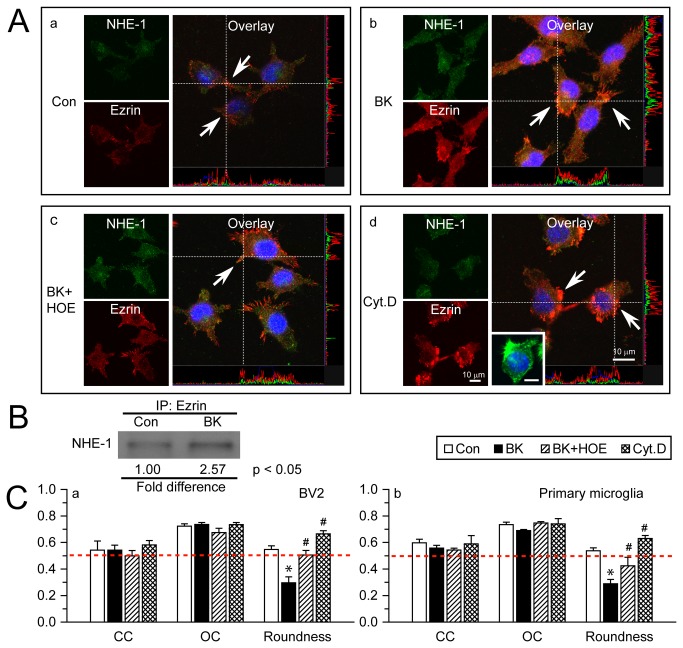
Figure 2. NHE-1 protein interacts with ERM in microglial lamellipodia.
A. Representative immunostaining images of NHE-1 and Ezrin in control (a), BK-stimulated (b), BK and HOE 642-treated (c), or Cyt.D-treated BV2 (d). Green: NHE-1. Red: Ezrin. Blue: To-pro-3 nuclear staining. Co-localization of green and red signal and their intensity spectrum were shown along the white dashed lines on the overlay images. BV2 or primary microglia were stimulated with 300 nM BK for 1 h or 100 nM Cyt.D for 20 h. Arrow: co-localization of NHE-1 and ezrin at lamellipodia. Inset in d: Alexa Fluor® 488 phalloidin signal in cells treated with Cyt.D. Scale bar in all panels: 10 µm. B. Representative blot of immunoprecipitation of NHE-1 with anti-ezrin antibody in control or BK-stimulated BV2 was shown. n = 4. p < 0.05 Con. vs. BK. C. Summarized data of Pearson’s correlation coefficient (CC), overlap coefficient (OC) and cell roundness values for NHE-1 and ezrin signals in BV2 (a) and primary microglial cells (b). Data are mean ± SEM. n = 3. * p < 0.05 vs. Con. # p < 0.05 vs. BK. Red dashed line: reference line of value 0.5.

