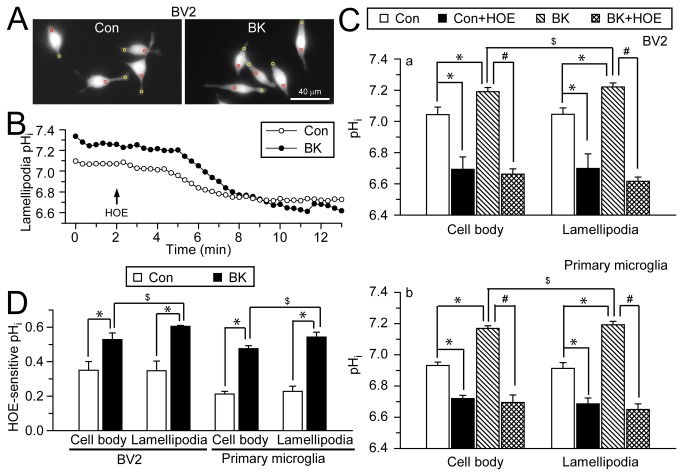
Figure 3. NHE-1 regulates pHi of cell body and lamellipodia in microglia.
A. BCECF-loaded images of BV2 microglia under control conditions (left panel) and after 30 min of 300 nM BK application (right panel). pHi was calculated in cell body (red circles) and lamellipodia (yellow circles) of each cell. Scale bar: 40 µm. B. Representative traces of lamellipodial pHi under control or BK stimulation. C. Summarized baseline pHi and pHi after 10 min of 1 µM HOE 642 in the absence or presence of BK in cell body and lamellipodia of BV2 (a) and primary microglia (b). D. HOE642-sensitive pHi under control and BK conditions. Data are mean ± SEM (n = 3-6 independent cultures; data were calculated as an average from 8–16 cells in each culture). * p < 0.05 vs. Con. # p < 0.05 vs. BK. $ p < 0.05 vs. cell body by paired t-test.

