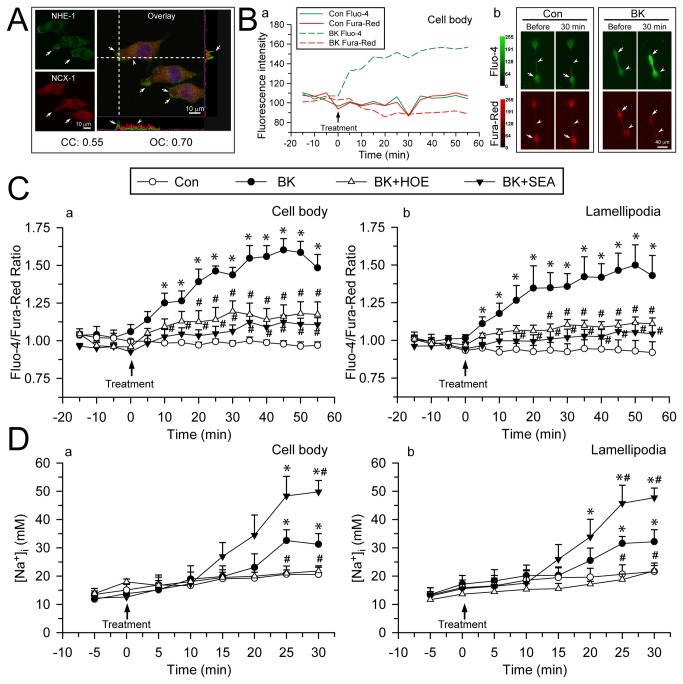
Figure 4. BK-mediated elevation of intracellular Ca2+ and Na+ results from concurrent activation of NHE-1 and NCXrev.
A. Double immunostaining of NHE-1 (Green) and NCX-1 (Red) in BV2 microglia under control conditions. Blue: To-pro-3 nuclear staining. Co-localization of green and red signal and their intensity spectrum were shown along the white dashed lines on the overlay images. Arrow: Higher expression level of NHE-1 than NCX-1 in lamellipodia edge. Arrowhead: Colocalization of NHE-1 and NCX-1 in cell body. Scale bar: 10 µm. Pearson’s correlation coefficient (CC) and overlap coefficient (OC) values for NHE-1 and NCX-1 signals were shown. B. (a) Representative fluorescence intensity changes of Fluo-4 (Green) and Fura-Red (Red) in BV2 cell body. (b) Representative fluorescence images of BV2 microglia in the absence or presence of BK (300 nM) for 0-30 min. Arrow: cell body; arrowhead: lamellipodia. Scale bar: 40 µm. C. Summarized data of BK-induced Ca2+ i elevation in BV2 cell body (a) and lamellipodia (b). For HOE and SEA treatment, 1 µM HOE 642 or 1 µM SEA 0400 was used. Data are mean ± SEM (n = 4-6 independent cultures, data were calculated from 12-19 cells for each group). D. Summarized changes of [Na+]i in primary microglia under control, BK, HOE 642 or SEA 0400 treatment in cell body (a) and lamellipodia (b). Data are mean ± SEM (n = 5-7 independent cultures, data were calculated from 15-21 cells for each group). * p < 0.05 vs. corresponding Con; # p < 0.05 vs. corresponding BK.

