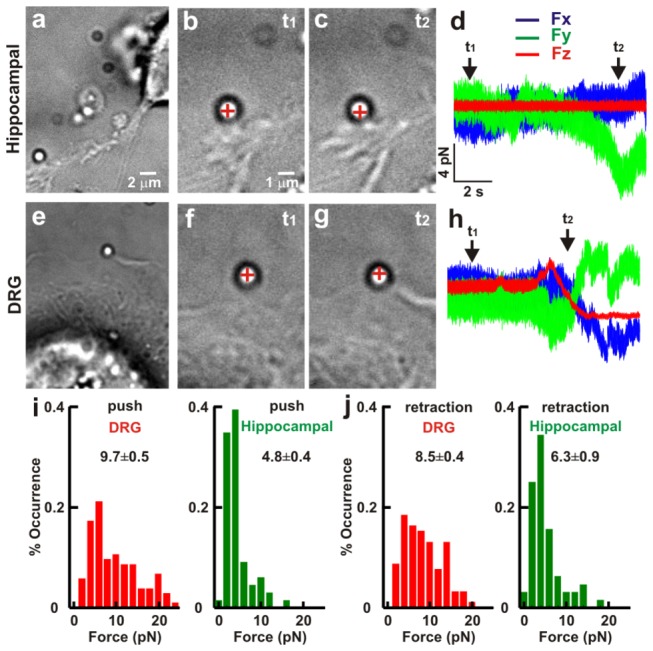
Figure 4. Comparison of the force exerted by lamellipodia from hippocampal and DRG GCs.

(a) Low resolution image of a bead trapped in front of a lamellipodium emerging from a hippocampal neuron. (b–c) High resolution images during a push by a lamellipodium. At t 1 the bead is in the optical trap (b) and at t 2 lamellipodium grows and pushes the trapped bead (c). The cross indicates the center of the optical trap. (d) The three components F x, F y, and F z of the force exerted by the lamellipodium from hippocampal neuron. (e–h) As in (a–d) but for a lamellipodium emerging from a DRG neuron. (i) Histogram of force measured during push in DRG (n=51) and hippocampal neurons (n= 31). (j) As in (i) but during retraction (n=47 and n=17 respectively). The trap stiffness is k x,y=0.10, k z=0.03 pN/nm. All values reported in i-j are given as mean ± SE.
