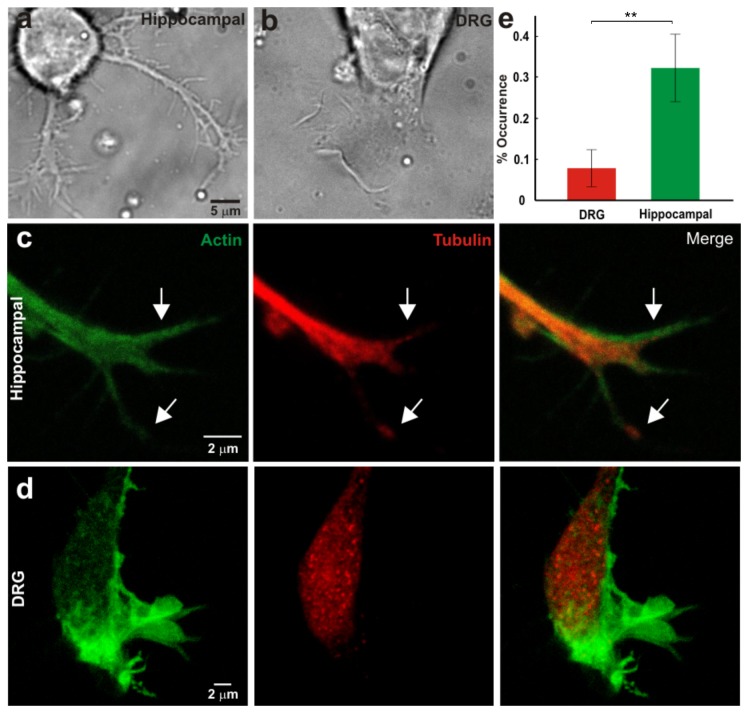
Figure 5. Morphoogical properties of hippocampal and DRG GCs.
(a–b) Low resolution image of neurites emerging from the soma of hippocampal (a) and DRG (b) neuron. (c) From left to right: confocal fluorescence images of a hippocampal GC stained for actin, tubulin and merge of the two stainings. Arrows indicate a filopodium with MTs inside. (d) As in (c) but for DRG GC. (e) The fraction of filopodia with a staining for MTs in DRG and hippocampal GC. Error bars indicate the SE. Significance indicates p < 0.01 (Student’s t-test).

