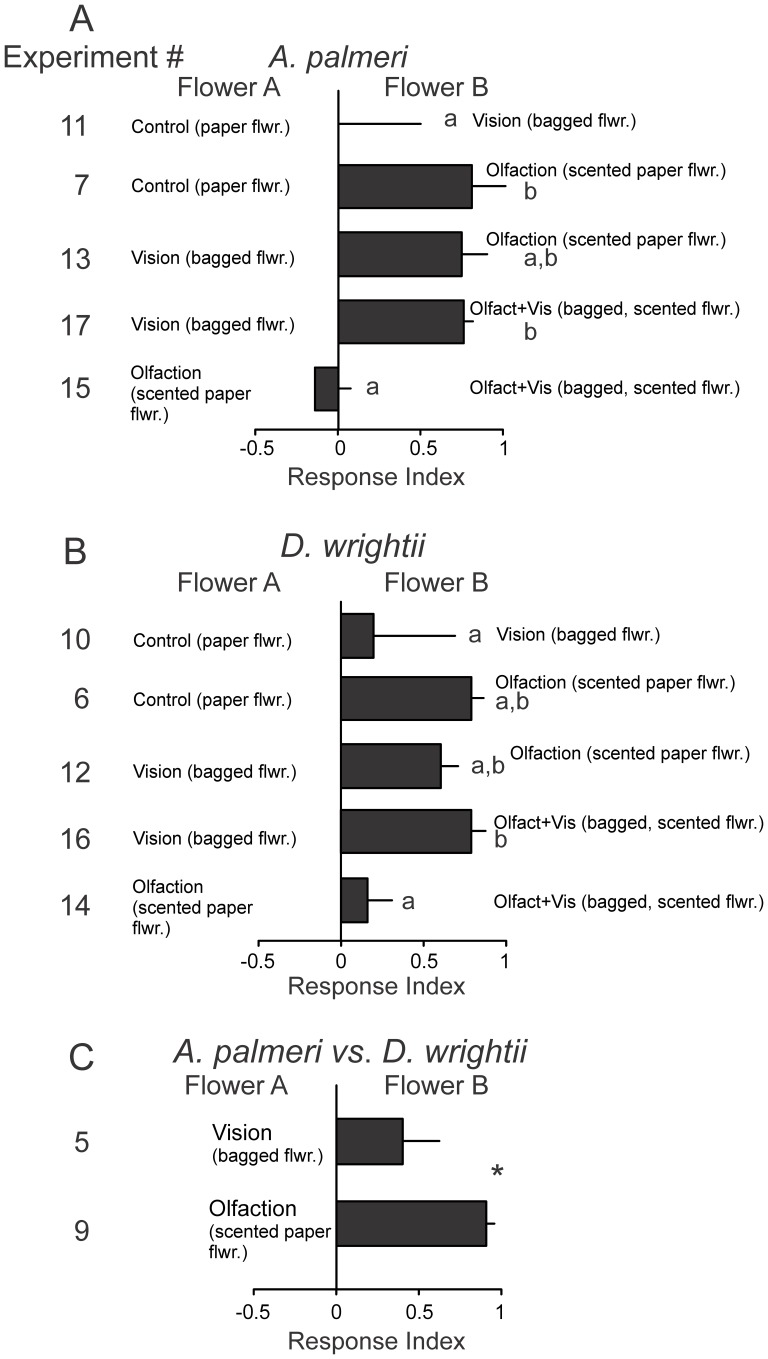
Figure 8. Response indices calculated from the time moths spent attempting to feed from the flowers in the single modality versus control, or single modality versus multimodal two-choice experiments.
(A) A. palmeri floral signals. (B) D. wrightii floral signals. (C) A. palmeri versus D. wrightii visual (top) and olfactory (bottom) signals. Letters (A,B) or asterisks (C) denote a significant difference between two-choice treatments (unpaired t-test: P<0.05).

