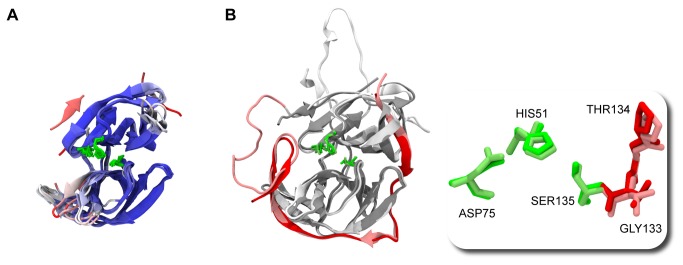
Figure 3. Structural alignments between (A) core region from all templates used in homology modeling, and (B) obtained model and recently available ligand bound DENV NS3PRO structure (PDB id: 3U1I).

[36]. In (A), residues were colored based on their Qres factor, obtained after a STAMP structure alignment performed with the VMD Multiseq plugin [68]. Color ranges from dark blue (highly conserved positions) to red (not conserved at all). In (B), crystallographic structure was colored with gray (NS3PRO) and red (NS2BCF); homology model was colored in lighter shades – white (NS3PRO) and pink (NS2BCF). In addition to the highly conserved active site residues position, the oxyanion hole was also preserved in this model (boxed detail).
