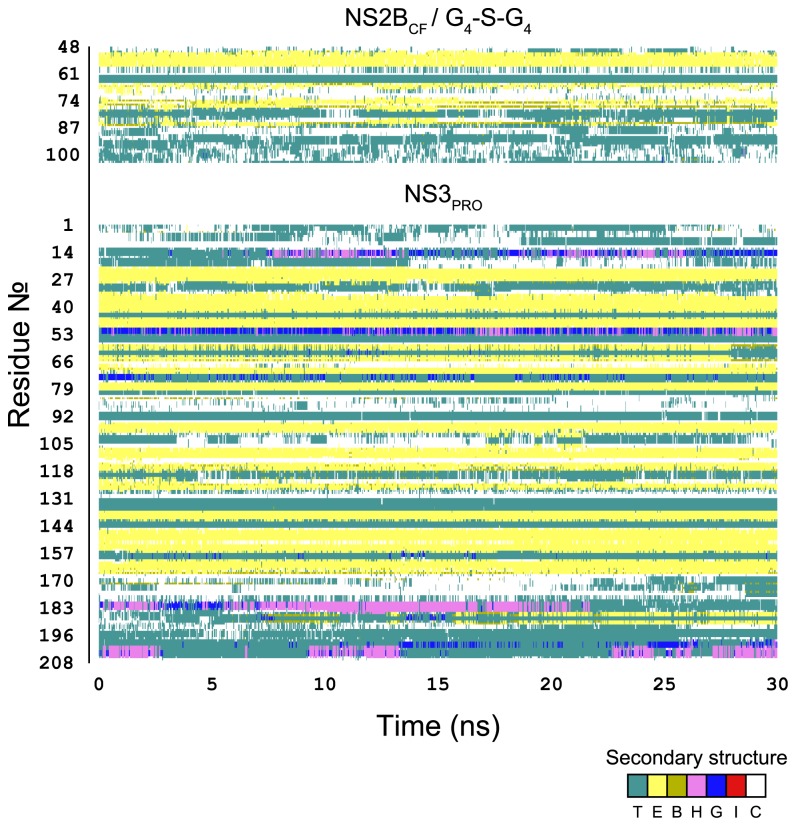
Figure 4. Secondary structure timeline analysis as computed by the timeline plugin contained in VMD.
In the graphic, the β-sheet components turn (T) and extended conformation (E) are represented in teal and yellow respectively; isolated bridges are in dark yellow; degrees of helix are in pink (α-helix), blue (3-10 helix) and red (π-helix); random coils are in white.

