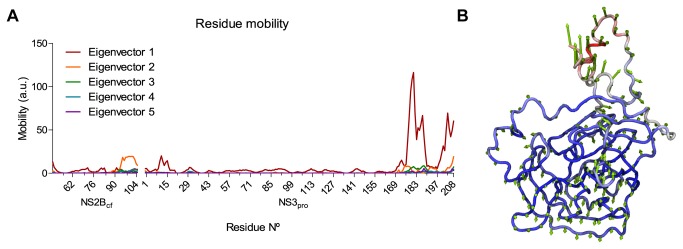
Figure 6. Individual residue mobility in principal component analysis.

(A) The greatest eigenvector represents NS3PRO C-terminal domain shifting, and the second eigenvector represents NS2BCF C-terminal and glycine linker shifts. (B) Normal mode visualization from the first eigenvector, also revealing small motions that may be important to binding site plasticity.
