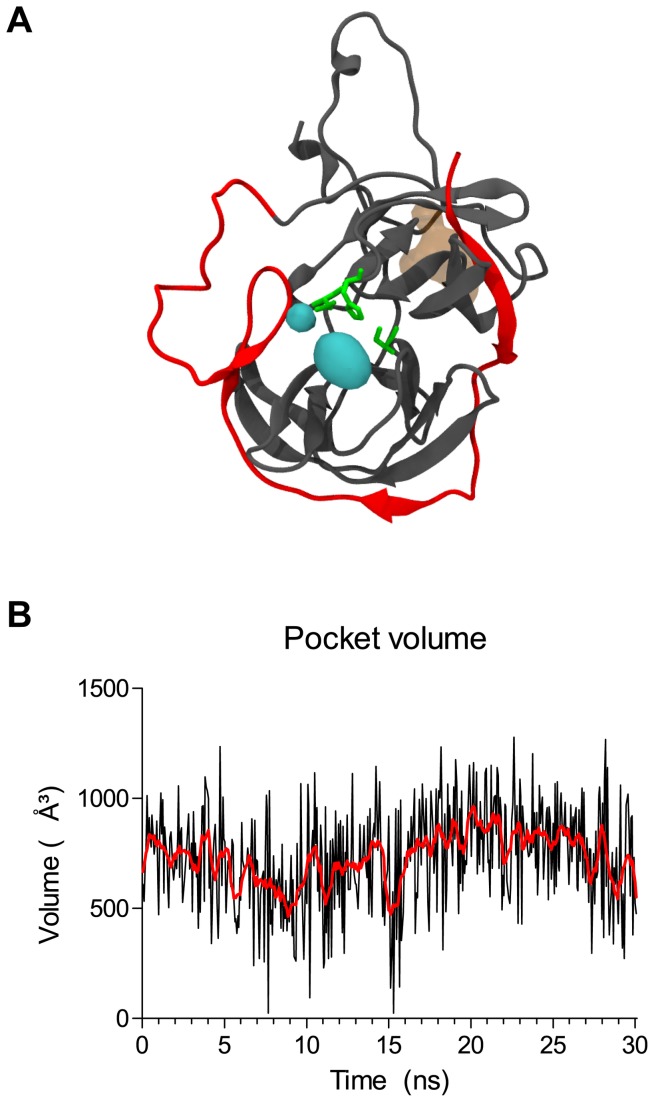
Figure 7. Pocket detection and evolution during MD simulation trajectory.
Active site pocket (A) was identified by METAPOCKET and later monitored for changes in volume (B) by MD Pocket. In (A), DENV NS3PRO is represented in gray; NS2BCF and the glycine linker are in red. Active site residues are represented by green sticks, and the detected pocket is shown in a cyan surface. The pocket opposed to the active site, usually found in ligand bound structures (35) is depicted in a brown surface, merely for illustration. In (B), the red line is a smoothed curve of the black line, intended to clarify the breathing behavior of the active site.

