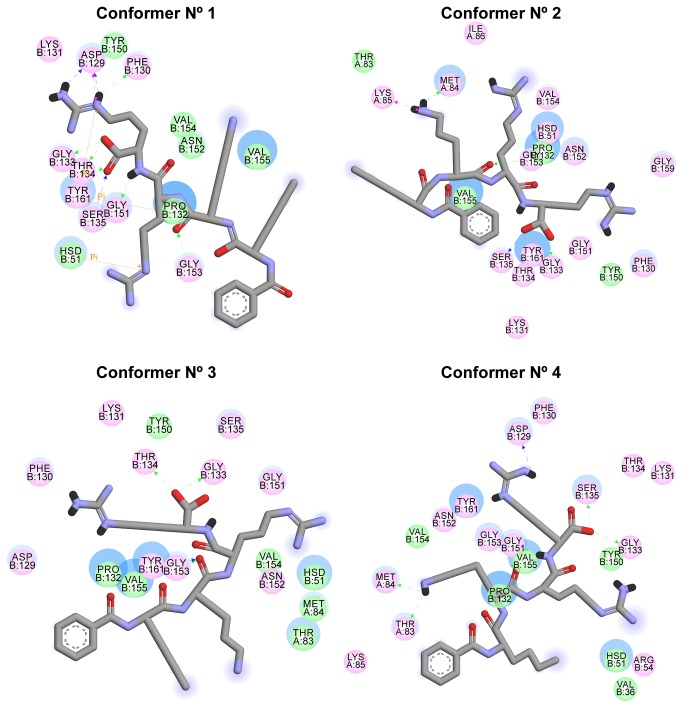
Figure 8. Binding mode fluctuations during the MD simulation.
Both ligand and binding site plasticity contributes to changes in the binding mode between the ligand and protein. The solvent accessible surface of an interacting residue or atom is represented by a blue halo around it. The diameter of the circle is proportional to the solvent accessible surface. Pink circles indicate residues involved in hydrogen-bond, polar or charged interactions; green circles indicates residues involved in van der Waals interactions; π-interactions are represented by orange lines; green arrows indicate hydrogen-bonds interactions with amino acid main chains; blue arrows indicate side chain hydrogen-bond interactions. Arrowhead directs towards the electron donor.

