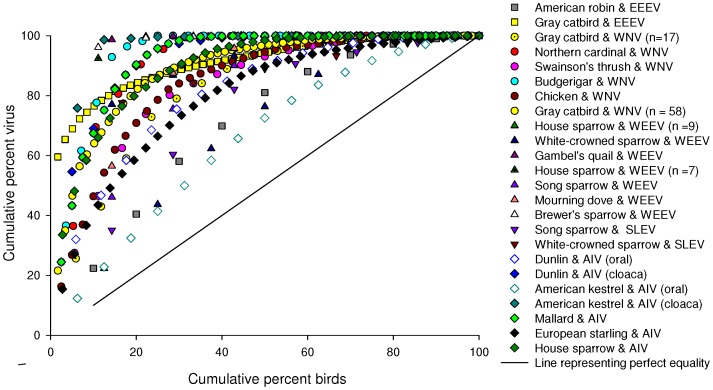
Figure 1. Cumulative distribution functions (i.e., Lorenz curves) for 17 different bird species infected with different viral pathogens (as noted), demonstrating that most of the virus shed by an infected population was detected in a minority of the individuals in that population.
The x-axis is percent of total potentially transmissible group virus and the y-axis is the percent of the total number of birds. Symbol shape is grouped by pathogen and symbol color is grouped by species. For AIV in dunlin and American kestrel we summed the samples for oral and cloacal swabs separately. Replicate species-virus curves represent different experimental infection studies that differ by date, location of the study and sample size (as indicated in parentheses).

