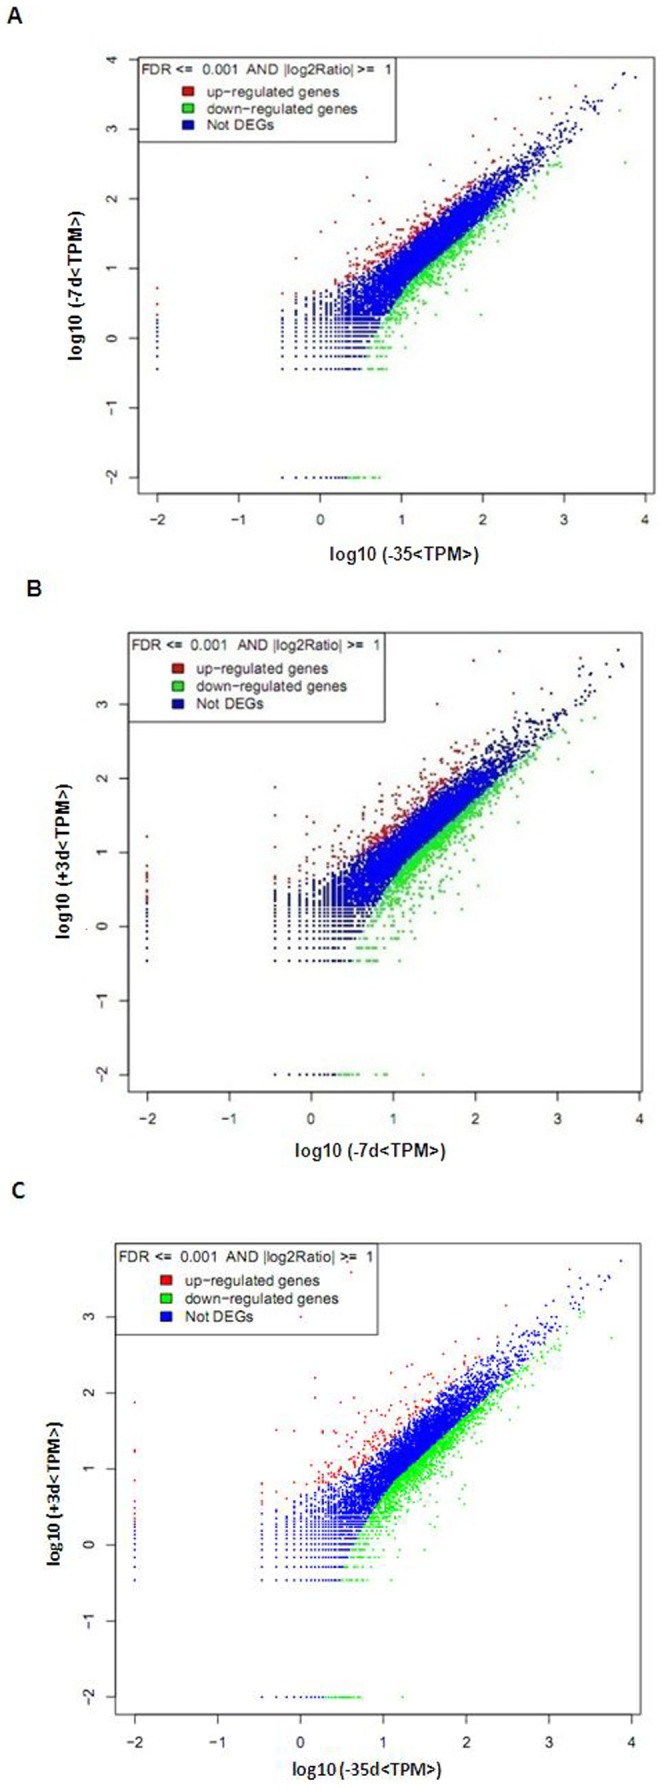
Figure 3. Pairwise comparisons of the level of gene expression between libraries.

To compare the level of gene expression between two libraries, each library was normalized to TPM. (A) Differentially expressed genes at −7 d compared with −35 d. (B) Differentially expressed genes at +3 d compared with −7 d. (C) Differentially expressed genes at +3 d compared with −35 d. Red dots represent upregulated transcripts. Green dots represent downregulated transcripts. Blue dots represent transcripts that did not change significantly. The parameters FDR≤0.001 and |log2 Ratio|≥1 were used as the threshold to judge the significance of the difference in gene expression. See supplementary data 1, 2 and 3 for details of these differentially expressed genes.
