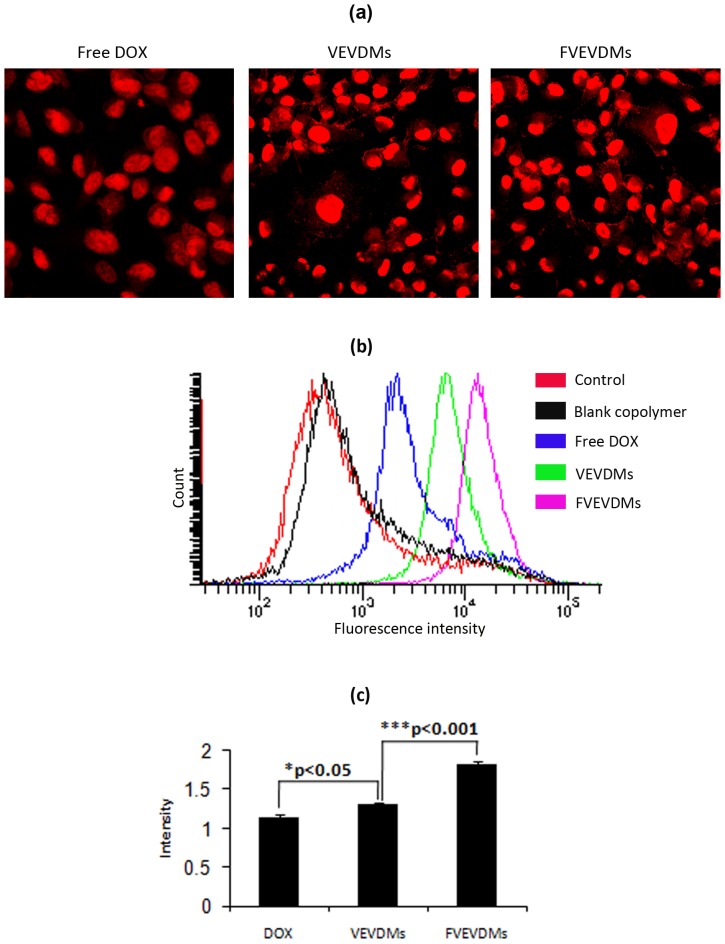
Figure 5. Cellular uptake showing comparison of intracellular fluorescence of doxorubicin: Incubation of MDAMB231 cells with different doxorubicin formulations (1 µM) for 2 h is shown by (a) Confocal microscopy images showing intracellular fluorescence of doxorubicin (b) Flow cytometry histograms showing intensity of uptake (c) Comparison of uptake efficiency by intensity of doxorubicin fluorescence.
Bars marked with *p<0.05,***p<0.001 shows the level of significance of difference at the same concentration (n = 3).

