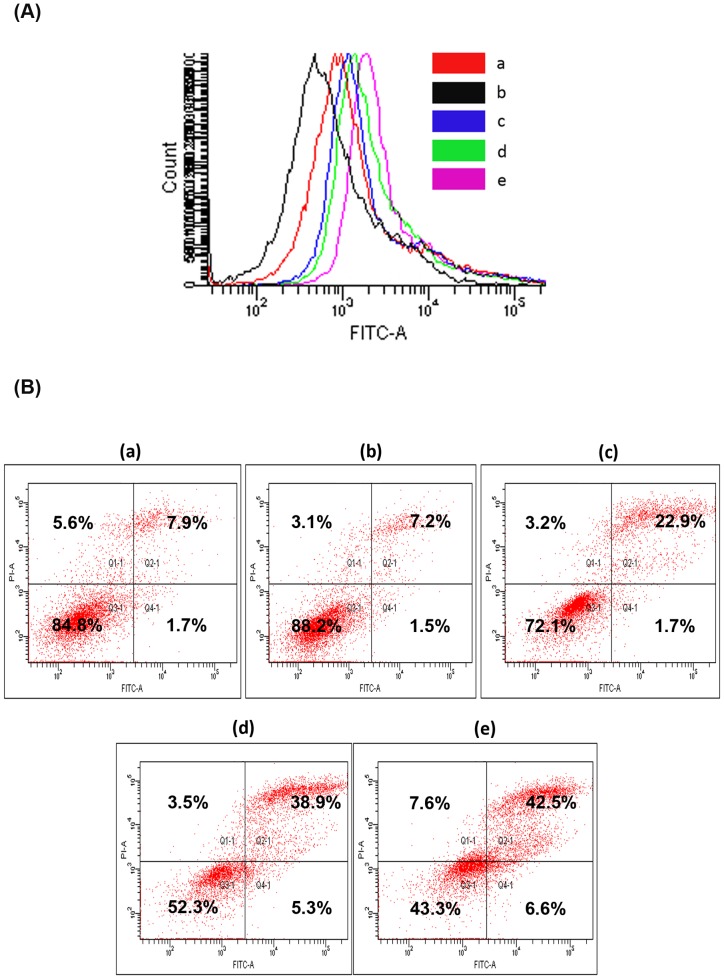
Figure 7. Annexin V-PI stain assay.
(A) Apoptosis determined by flow cytometry in MDAMB231 cells treated with different DOX fomulations (0.01 µM) for 24 h after staining with Annexin V-FITC. Cells showing higher fluorescence (shift towards right) represent apoptosis (B) FACS analysis of Annexin V and PI in MDAMB231 cells treated with different DOX formulations (0.01 µM) for 24 h where Annexin V+ PI+; Annexin V+ PI−; Annexin V− PI+ and Annexin V− PI− indicate late apoptotic; early apoptotic; necrotic and live cells where a–e represent treatments as a:Control; b:Blank copolymer; c:Free DOX; d:VEVDMs; e:FVEVDMs.

