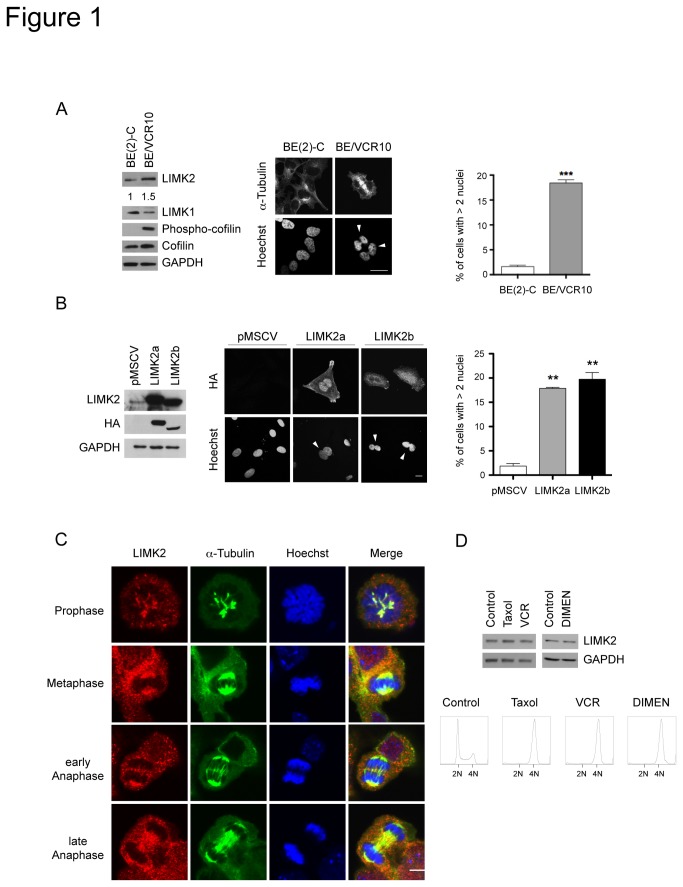
Figure 1. LIMK2 overexpression results in increased number of multinucleated cells.
(A) A high percentage of BE/VCR10 cells are multinucleated. Fixed BE(2)-C and BE/VCR10 cells were stained with FITC-conjugated anti-α-tubulin antibody and Hoechst. White arrowheads indicate multinucleated cells. Scale bar = 20 µm. The percentage of multinucleated cells shown on the right panel is represented as mean ± S.E.M of three independent experiments (***, p < 0.0001, unpaired t-test). The blots on the left show whole cell lysates of the BE(2)-C and BE/VCR10 cells analyzed by immunoblotting with the indicated antibodies. The numbers below the top panel represent the fold changes in the indicated protein levels. (B) Overexpression of LIMK2a or LIMK2b proteins in SHEP cells increases ploidy. Stable SHEP cell lines expressing HA-tagged LIMK2a or LIMK2b or vector control (pMSCV) were generated by transduction with retroviruses. The left panel shows the relative expression of the ectopic LIMK2 proteins. Cells expressing LIMK2a or LIMK2b were fixed and stained with an anti-HA antibody and Hoechst (middle panel). White arrowheads indicate multinucleated cells. Scale bar = 20 µm. The percentage of multinucleated cells is shown on the right panel represented as mean ± S.E.M of three independent experiments (**, p < 0.001, unpaired t-test). (C) LIMK2 localizes to the mitotic spindle microtubules. An unsynchronized population of NIH-3T3 cells was fixed and immuno-stained with an anti-LIMK2 antibody (red), FITC-conjugated anti-α-tubulin antibody (green) and Hoechst (blue). Scale bar = 20 µm. (D) LIMK2 levels do not change during cell division. SHEP cells were treated with 0.5 µM taxol, 0.1 µM vincristine (VCR) or 1 µM dimethylenastron (DIMEN) for 20 hours and mitotic cells were collected by mitotic shake-off. Half of the cells were used to prepare whole cell lysates that were immunoblotted with anti-LIMK2 as well as anti-GAPDH antibodies. The rest of the cells were fixed, stained with propidium iodide and analyzed by flow cytometry (bottom panels). The cell cycle profiles show the G2/M arrest with the different treatments.

