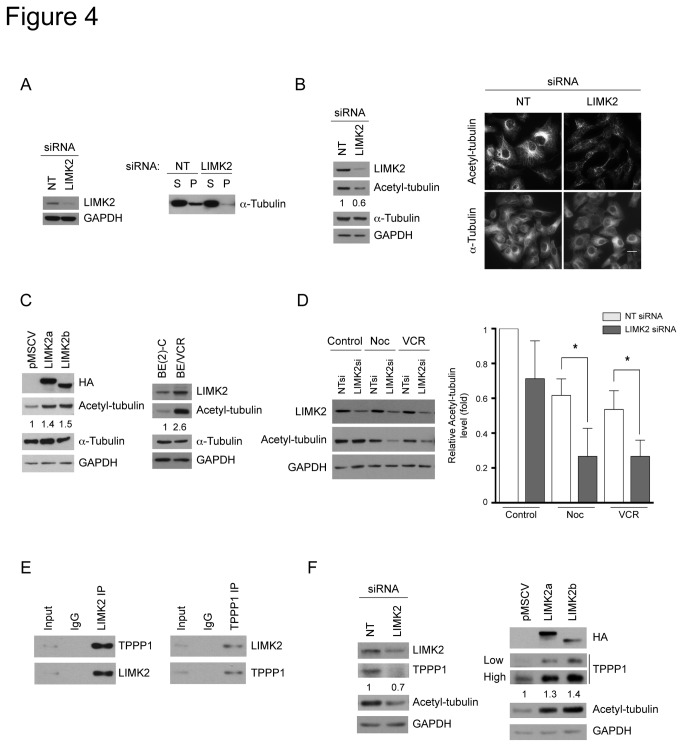
Figure 4. LIMK2 affects microtubule acetylation and TPPP1 levels.
(A) LIMK2-depleted cells have reduced amounts of polymerized tubulin. SHEP cells were transfected with LIMK2 or non-targeting control (NT) siRNA and 72 hours later the soluble (S) and polymerized (P) tubulin fractions were separated by centrifugation and analyzed by immunoblotting. A representative immunoblot of three experiments is shown. The efficiency of the LIMK2 knockdown and the loading control is shown on the left panel. (B) LIMK2 knockdown cells show reduced levels of acetylated tubulin. The numbers below the second panel represent the relative level of acetylated tubulin. Cells transfected with the indicated siRNAs were analyzed by immunoblotting and immunofluorescent staining. Bar = 20 µm. (C) SHEP cells overexpressing LIMK2 have increased levels of acetylated tubulin. SHEP cells overexpressing LIMK2a and LIMK2b as well as BE(2)-C and BE/VCR10 cells were analyzed by immunoblotting. The numbers below the second panel represent the relative level of acetylated tubulin. (D) LIMK2 knockdown cells are more sensitive to microtubule depolymerization induced by microtubule-targeted drugs. SHEP cells transfected with the indicated siRNAs were treated with 0.5 µg/ml nocodazole (Noc) or 0.1 µM vincristine (VCR) for 24 hours and analyzed by immunoblotting. The graph indicates the relative acetylated tubulin levels compared with the NT siRNA control (vehicle) represented as mean ± S.E.M of three independent experiments (*, p < 0.05). (E) LIMK2 and TPPP1 interact in SHEP cells. LIMK2 or TPPP1 were immunoprecipitated from SHEP cell lysates and the respective co-immunoprecipitated TPPP1 (left panel) or LIMK2 (right panel) were detected by immunoblotting. (F) LIMK2 modulates TPPP1 protein levels. Lysates from SHEP cells transfected with LIMK2 or control (NT) siRNA (left panels) and LIMK2a or LIMK2b overexpressing SHEP cells (right panels) were analyzed by immunoblotting. Two different exposures of TPPP1 immunoblot are shown (low and high). The numbers below the top panels in B, C, and F represent the folds change in the indicated protein levels.

