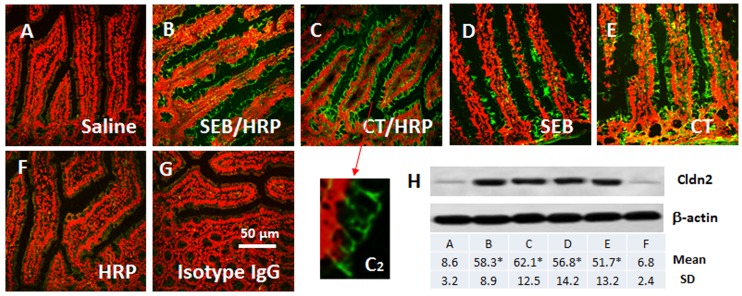
Figure 1. Expression of Cldn2 in the mouse intestinal epithelium.
Grouped mice were sensitized to HRP or only treated with adjuvant SEB or CT. A–G, representative confocal images show the expression of Cldn2 (in green) on the epithelia. Panel C2 is an enlarged image spot in panel C (pointed by an arrow). The red color is the nucli that was stained with propidium iodide. H, the immune blots show the Cldn2 protein (22 kDa) in the mouse jejunal epithelia. The table below indicates the summarized integrated density of the immune blots. *, p<0.01, compared with the saline group. Each group consisted of 6 mice. Samples from each mouse were processed separately.

