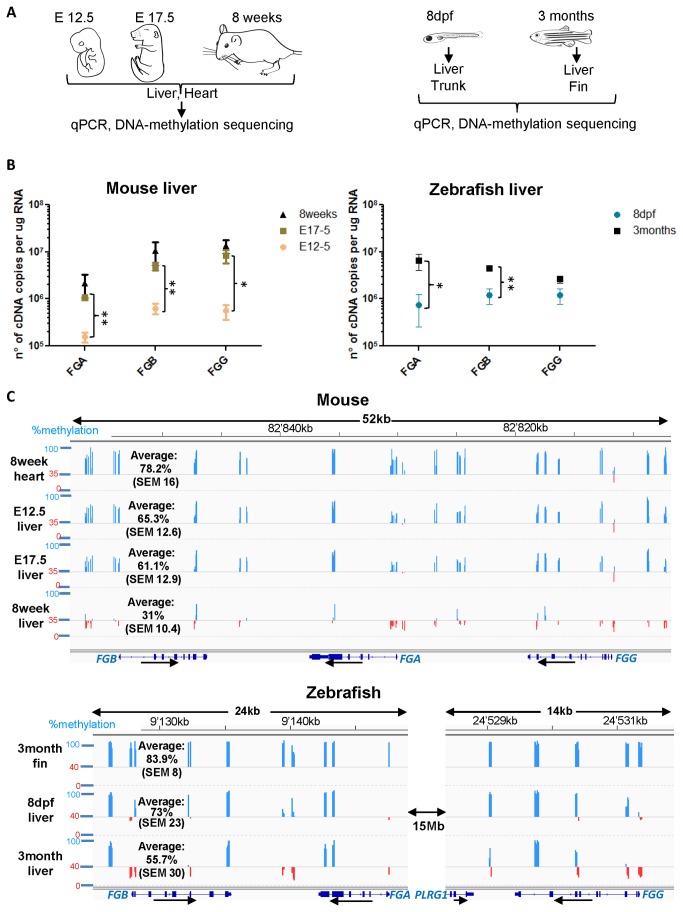
Figure 3. Changes in fibrinogen expression and fibrinogen DNA methylation during mouse and zebrafish development.
(A) Experimental approach used to compare the changes in expression of the three fibrinogen genes with DNA methylation of the fibrinogen locus. The same mouse tissues were used to perform both experiments, except for E12.5 tissues, where two tissue samples were pooled per experiment (see Materials and Methods). For qPCR and DNA methylation sequencing on zebrafish tissues, the livers and caudal fins (for 3 month old females) or trunks (for 8dpf larvae) were dissected and DNA and RNA were extracted from the same samples. The experiments were performed with three biological replicates. (B) Absolute quantification of mouse and zebrafish fibrinogen RNA in the liver. The number of cDNA copies per µg RNA was determined by interpolation of the qPCR results on a standard curve of known concentrations of plasmids containing the respective cDNAs. The mean number of cDNA copies plus SEM are shown on a logarithmic scale, n=3. Statistical testing was performed using an unpaired t test (*P< .05, **P< .01). (C) Methylation percentages of individual CpGs analyzed are depicted as bars at their genome position using the Integrative Genomics viewer IGV [52] (for mouse: NCBI37/mm9, for zebrafish: Zv9/danRer7). A line is drawn at 35% methylation (mouse) or 40% (zebrafish); values above are depicted as blue bars and values below as red bars. Reference genes are shown below each graph and scales and genomic localization (mouse chromosome 3 reverse strand or zebrafish chromosome 1 forward strand) are shown above. Note that in zebrafish fgg is located ~15MB downstream of fga. The peaks represent the mean methylation of three biological replicates, the average methylation percentage plus SEM across the whole locus (for zebrafish the two loci shown) is given for each tissue.

