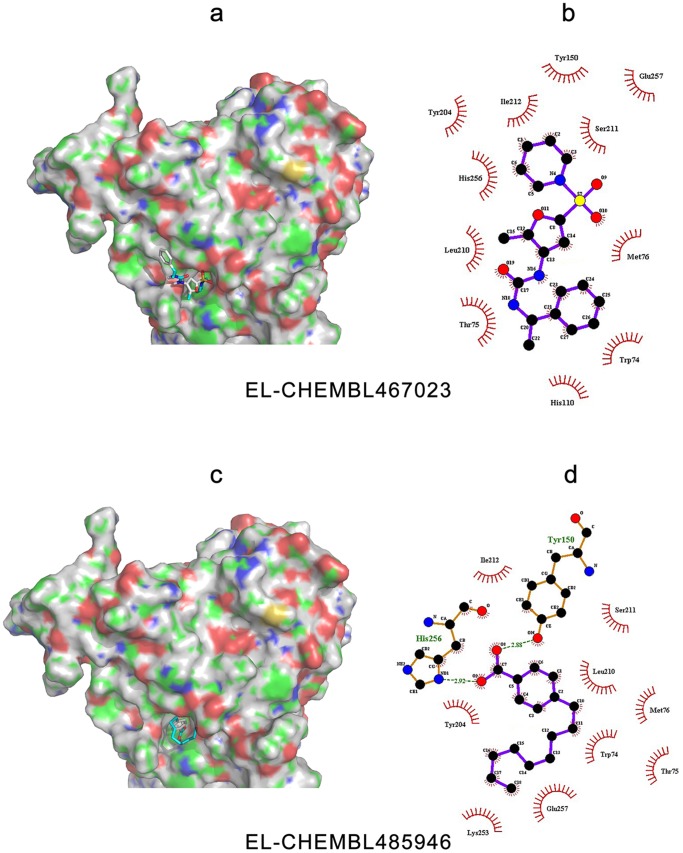
Figure 12. Binding modes and interactions of EL with its inhibitors, CHEMBL467023 and CHEMBL485946.
The pictures on the left side are the EL complexed with (a) CHEMBL467023 and (c) CHEMBL485946. The protein surface and binding pocket is colored, with blue representing positively charged region, red representing the negatively charged region, green representing the hydrophobic region and gray representing the protein backbone. The pictures on the right side were created by LigPlot+ to represent the interactions with (b) CHEMBL467023 and (d) CHEMBL485946, showing the inhibitors (purple), residues involved in hydrogen bonding with the ligand (brown), along with their hydrogen bonds (green), and residues involved in non-bonded interactions (red spikes).

