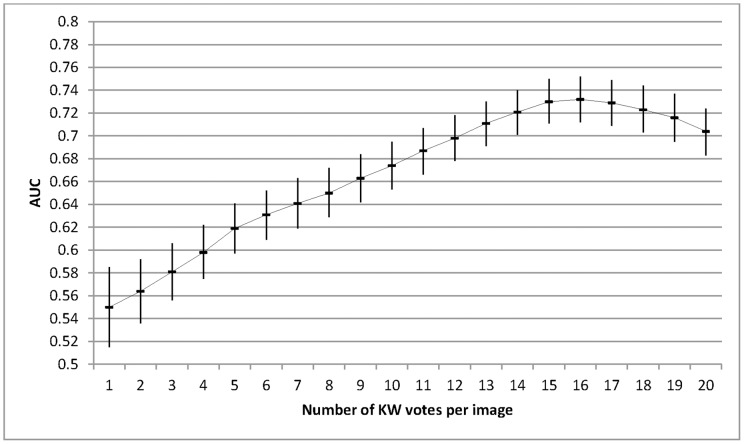
Figure 2. The AUC and associated 95%CI for trial 1 (0.03c) as a function of the number of KW gradings per image.
The AUC increases as the number of KW gradings increases with a peak at 16 individual gradings per image. A similar curve was obtained for all study designs in both trials, although a variation was seen in the optimal number of KWs needed to achieve a peak ROC.

